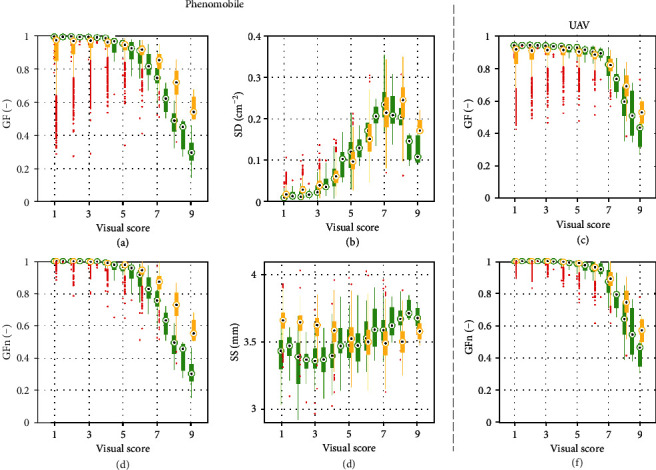
Figure 8.

Relationships between visual scores and Phenomobile-derived variables GF (a), GFn (d), SD (b), and SS (e), and between visual scores and UAV-derived variables GF (c) and GFn (f). Green boxes correspond to 2016, and orange boxes correspond to 2017. For each box, the central mark is the median, the edges of the box delimit the 25th and 75th percentiles, the whiskers extend to the most extreme datapoints that are not considered to be outliers, and the outliers are plotted individually in red.
