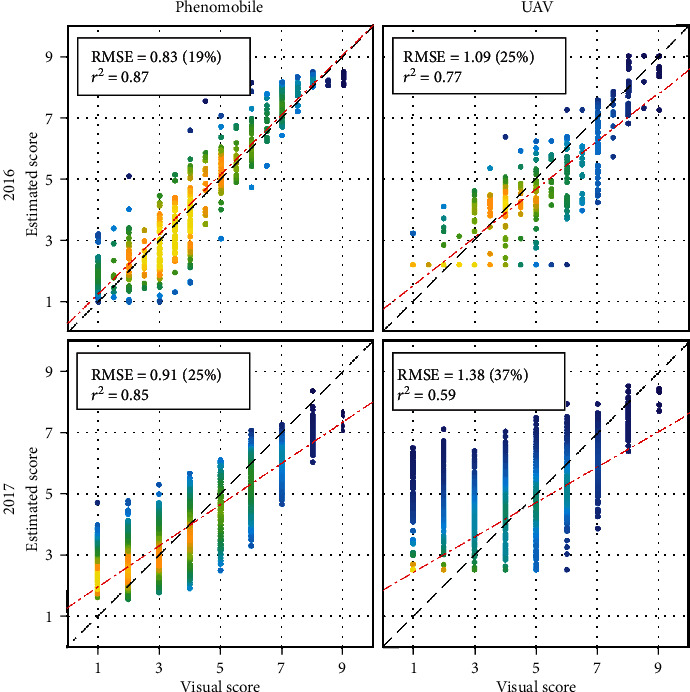
Figure 9.

Score estimation results obtained for 2016 (top) and 2017 (bottom) using Phenomobile-derived GFn, SD, and SS (left) or UAV-derived GFn (right) as input(s) to the neural network. For each plot, one year is used for training and the other year is used for validation. Every estimate is the median of ten estimates obtained with ten neural networks. Absolute and relative RMSE, squared Pearson's correlation coefficient, and linear fit are shown. The color indicates the point density, ranging from blue for low density to yellow for high density.
