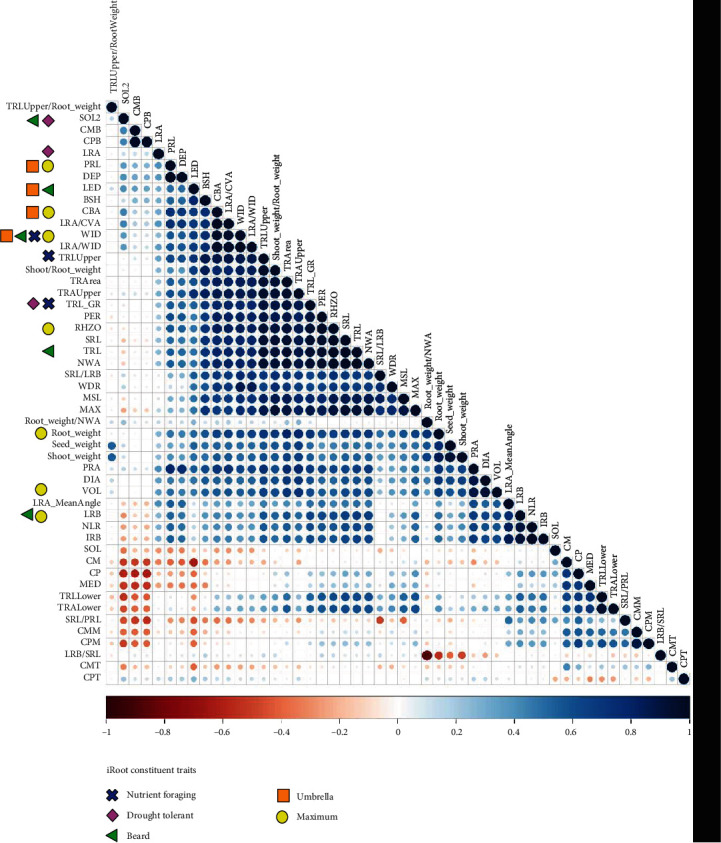
Figure 1.

Pearson's correlations of root traits. Correlations at 9 days after germination measured on 292 soybean genotypes (replications = 14). Hierarchical clustering was used to group similar traits. Symbols (shape and color) denote RSA traits used in the corresponding iRoot index (cumulative trait scores).
