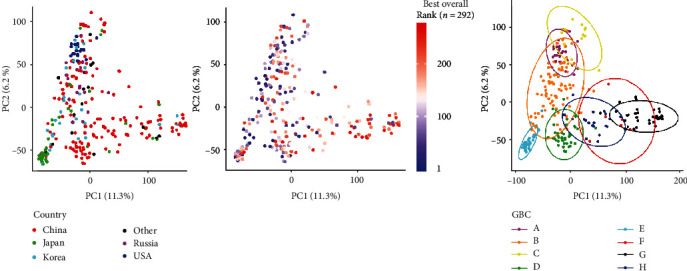
Figure 3.

Principal component analysis of 292 soybean genotypes. Genotypic data 35,448 SNP markers. The two principal components accounting for 11.3% (PCA1) and 6.2% (PCA2) of the genetic variation. (a) Color represents the country of origin. (b) Color represents “maximum” iRoot category rank. Blue (best rank) to red (worst rank) color gradient is used to show ranks of 292 soybean genotypes. (c) 292 genotypes colored by their allotted genotype-based cluster (GBC).
