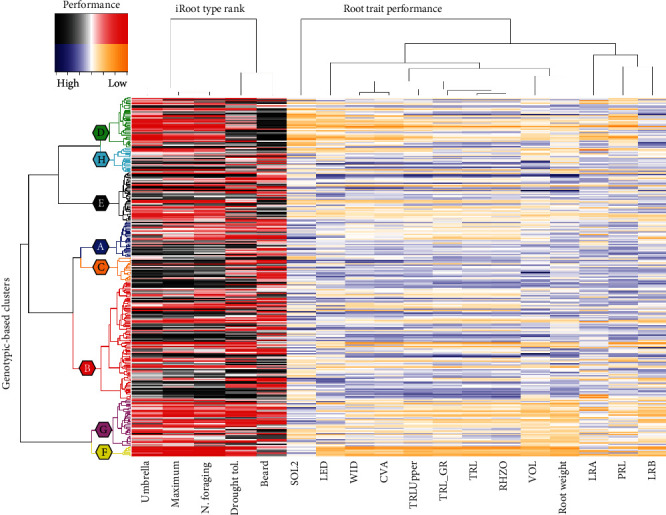
Figure 5.

Heatmap displaying relationships between genotypes and phenotypes. Correlations between genotype (y-axis) and phenotype (x-axis) for 9 d after germination using data from 292 soybean accession studies for 13 root traits (TRL, PRL, WID, CVA, LRB, VOL, LRA, SOL2, LED, RHZO, TRL_GR, TRLUpper, and Root_weight) and 5 iRoot categories (nutrient foraging, drought tolerant, umbrella, beard, and maximum) (replications per accession = 14). The dendrogram on the y-axis was developed using hierarchical clustering using SNP data; the x-axis displays iRoot categories and 13 root traits that comprise iRoot categories.
