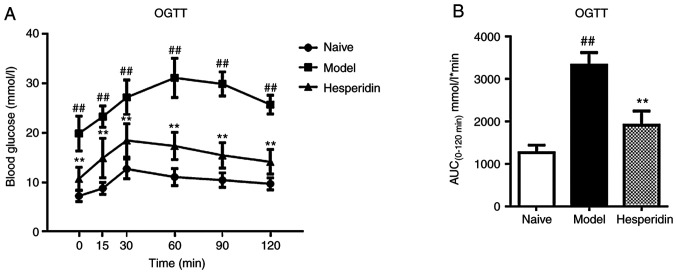
Figure 2.
Effect of hesperidin on OGTT results. At the end of the model establishment, rats were administered 2.5 g/kg glucose via oral gavage with before blood was sampled at 0, 15, 30, 60, 90 and 120 min post-glucose challenge. (A) Blood glucose levels during OGTT. (B) AUC calculated using GraphPad Prism. Data are presented as the mean ± SD, n=8. ##P<0.01 vs. naïve group; **P<0.01 vs. model group. OGTT, Oral glucose tolerance test; AUC, Area under the curve.

