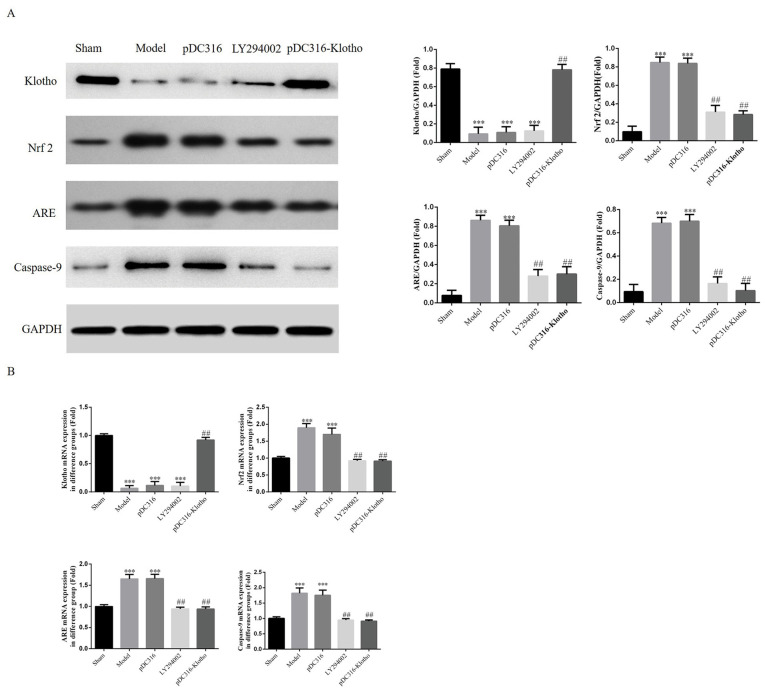
Figure 6.
Klotho, Nrf 2, ARE and caspase-9 protein and mRNA expression levels of different groups determined by WB and RT-PCR assay. (A) Relative protein expression of different groups by WB assay. (B) Relative mRNA expression of different groups by RT-PCR assay. Sham, sham group; model, myocardial infarction model group; pDC316, empty pDC316 were injected in rats based on myocardial infarction model group; LY294002, injection with LY294002 based on myocardial infarction model group; pDC316-Klotho, Klotho gene with pDC316 were injected in rats based on myocardial infarction model group. ***P<0.001 vs. sham group; ##P<0.01 vs. model group. WB, western blotting; RT-PCR, reverse transcription-PCR.

