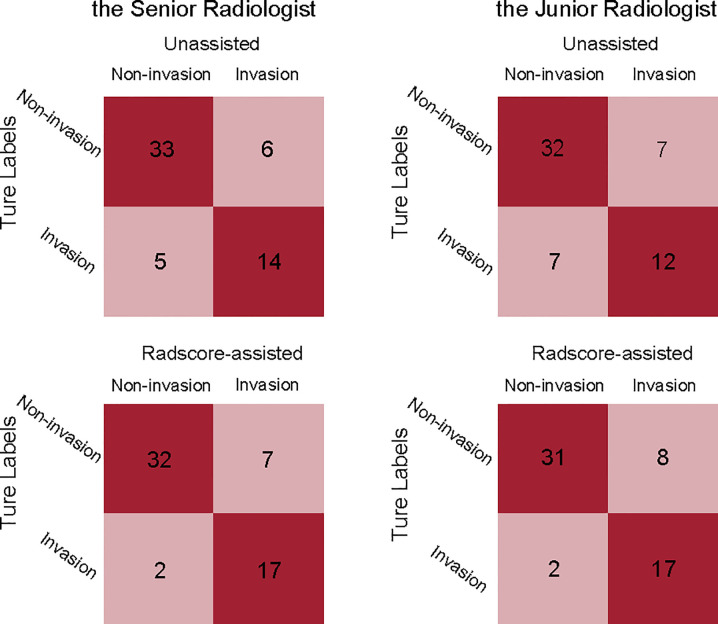
Figure 4.
Confusion matrices comparing the true labels and the diagnostic labels. Each plot illustrates performance on the validation cohort. left, the senior radiologist’s unassisted evaluation and Radscore-assisted evaluation; right, the junior radiologist’ unassisted evaluation and Radscore-assisted evaluation. Radscore, radiomics score.

