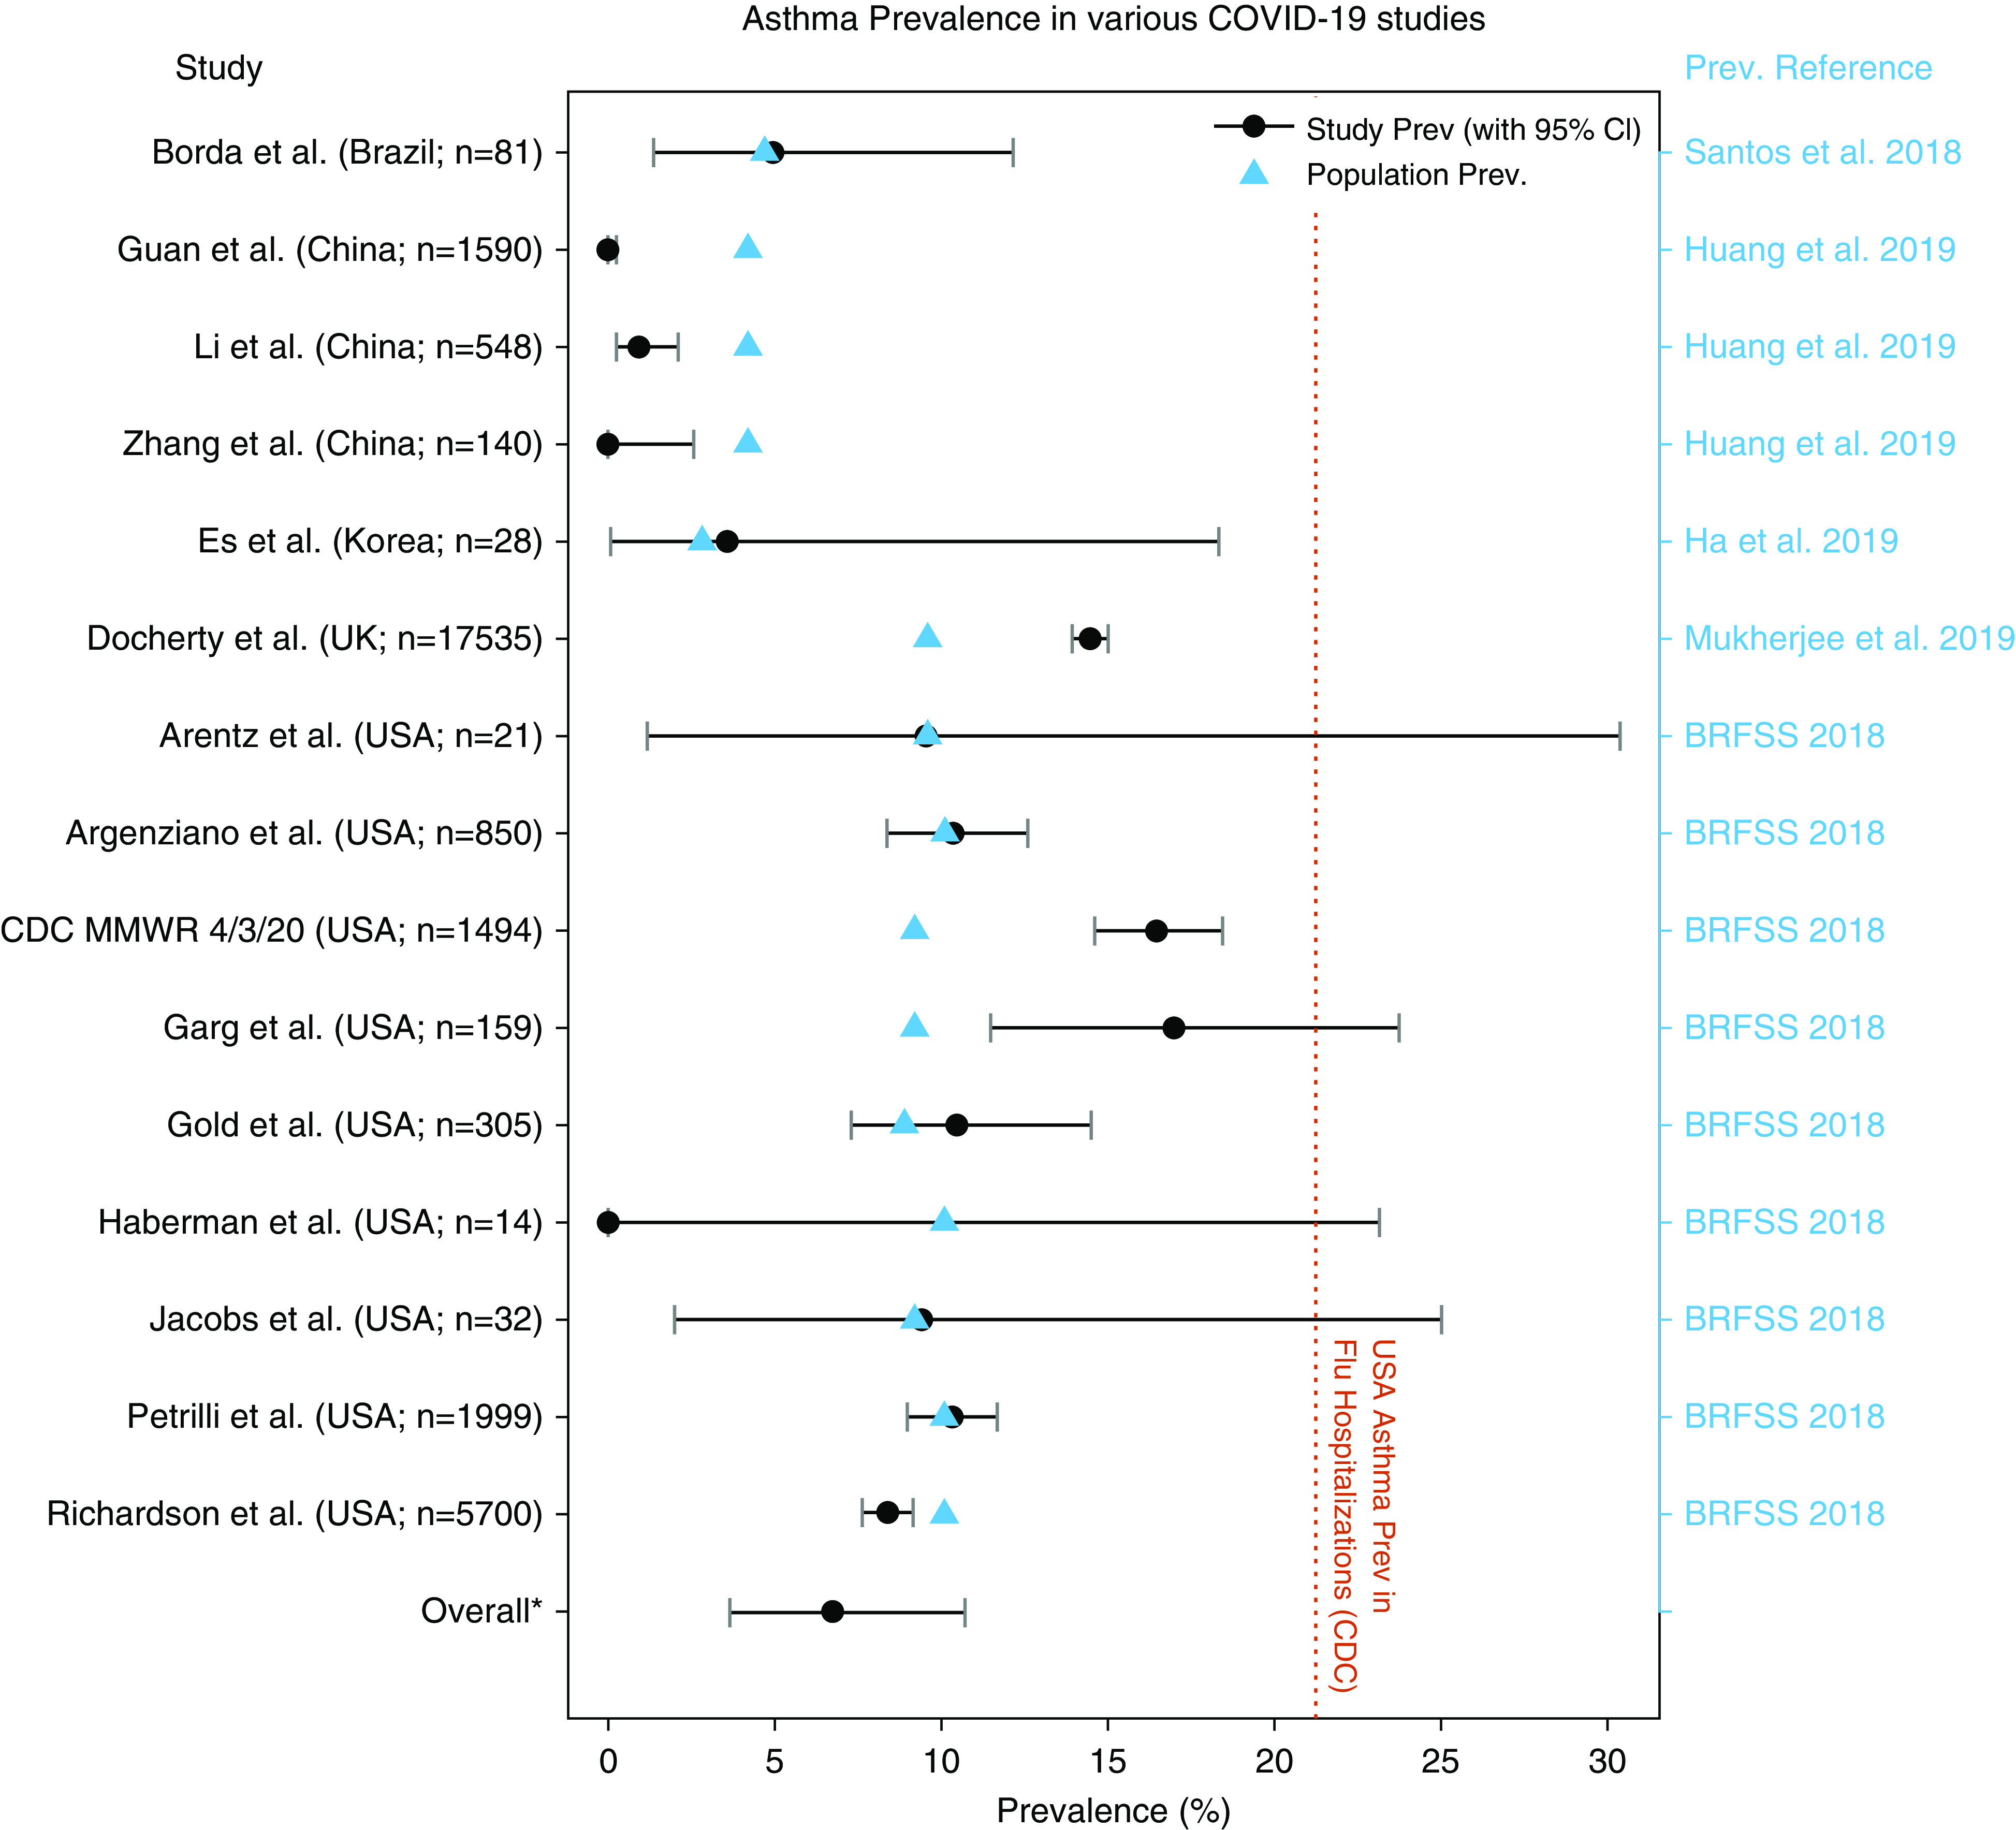
Figure 2.

Comparing the prevalence (Prev.) of asthma in a series of COVID-19 studies compared with population-level Prev. The orange line corresponds to the 4-year average U.S. asthma Prev. among those hospitalized with flu (CDC FluView Data) (7). For a full study list, please see the References. *Overall (or “pooled”) Prev. (6.8%; 95% confidence interval [CI], 3.7–10.7%) and the associated CI assume random study-level effects. BRFSS = Behavioral Risk Factor Surveillance System; CDC = U.S. Centers for Disease Control and Prevention; COVID-19 = coronavirus disease 2019; flu = influenza; MMWR = Morbidity and Mortality Weekly Report.
