

Abstract
Individualisation can improve resistance training prescription. This is accomplished via monitoring or autoregulating training. Autoregulation adjusts variables at an individualised pace per performance, readiness, or recovery. Many autoregulation and monitoring methods exist; therefore, this review’s objective was to examine approaches intended to optimise adaptation. Up to July 2019, PubMed, Medline, SPORTDiscus, Scopus and CINAHL were searched. Only studies on methods of athlete monitoring useful for resistance-training regulation, or autoregulated training methods were included. Eleven monitoring and regulation themes emerged across 90 studies. Some physiological, performance, and perceptual measures correlated strongly (r ≥ 0.68) with resistance training performance. Testosterone, cortisol, catecholamines, cell-free DNA, jump height, throwing distance, barbell velocity, isometric and dynamic peak force, maximal voluntary isometric contractions, and sessional, repetitions in reserve-(RIR) based, and post-set Borg-scale ratings of perceived exertion (RPE) were strongly associated with training performance, respectively. Despite strong correlations, many physiological and performance methods are logistically restrictive or limited to lab-settings, such as blood markers, electromyography or kinetic measurements. Some practical performance tests such as jump height or throw distance may be useful, low-risk stand-ins for maximal strength tests. Performance-based individualisation of load progression, flexible training configurations, and intensity and volume modifications based on velocity and RIR-based RPE scores are practical, reliable and show preliminary utility for enhancing performance.
Key words: autoregulation, strength, rating of perceived exertion (RPE), repetitions in reserve (RIR), velocity
Introduction
The primary goal of monitoring and regulating resistance training is to more closely match the intended training stress with readiness and recovery to optimize adaptation on an individual basis. However, there is a paucity of research addressing the principle of individualisation and subsequently the understanding in this area is rudimentary (Kiely 2012). Individuals recover from resistance training at different rates (McLester et al., 2003) and genetic (Timmons 2011), biological age (Lemmer et al., 2000), menstrual cycle phase (Sarwar, Niclos, and Rutherford 1996), and training age (Baker 2013) differences result in muscular adaptations occurring at different magnitudes. In fact, those beginning the same resistance training program may experience no increase in maximal strength or hypertrophy while others may increase muscle size by ~60% and increase maximal strength by as much as 250% after a 12 week period (Hubal et al., 2005). However, despite the fact that genetic differences are immutable, there is evidence that adaptation to training can be improved when program-design is tailored to the individual (Beaven, Cook, and Gill 2008).
For advanced athletes, an effective resistance training approach may require individualisation based on the dynamic state of recovery and performance of the athlete. According to Selye’s General Adaptation Syndrome (1950), a stressor is required for adaptation. However, to adapt to stress, an individual must be able to recover, which is impacted by outside stressors. In the context of exercise, if a stressor is beyond the capacity for adaptation (defined by Seyle as “exhaustion”), improvements in performance can cease or regress. The amount of time it takes for positive adaptations to return and continue, determines whether this regression was considered non-functional overreaching (shorter and less severe) or overtraining (longer and more severe) (Meeusen et al., 2013). Factors such as sleep (Bulbulian et al., 1996), nutrition (Helms et al., 2015) and psychological stress (Bartholomew et al., 2008) can all impact adaptation. Indeed, those who experience more negative life stress appear to gain less strength in response to resistance training compared to their lower-stress counterparts (Bartholomew et al., 2008). It is no wonder numerous strength and conditioning authors recommend some form of athlete monitoring occur alongside a training plan to ensure the predicted response to training occurs, and if an unpredicted response occurs, training be adjusted (Davison, et al., 2009; Lambert and Borresen 2010).
Arguably, adjusting a plan based on how the individual responds, how their needs change, and how their ongoing state of readiness and recovery shift should be a continual process to optimize adaptation (Kiely 2012). Thus, a cornerstone skill of the strength and conditioning practitioner is the ability to make training adjustments in an effective manner to reduce the frequency and severity of injury, overtraining, and optimise the rate and magnitude of adaptation. However, this subjective aspect of athletic training largely falls under “the art” rather than the science of strength and conditioning and there is a learning curve for novice practitioners. For this reason, “autoregulation” is an intriguing area of study. Autoregulation is described as training that automatically adjusts to the athlete’s performance to allow improvement at an individualised pace to optimize adaptation (Mann et al., 2010). While it is unlikely (and not necessarily desirable) that coaching input will ever be divorced from training, if certain aspects of training regulation can be automatically embedded in an objective and systematic manner, this reduces the chance of human error and allows for greater focus on the elements of coaching requiring subjective decision making.
With this preamble in mind, this narrative review is a brief treatise of the various methods for monitoring the state of the athlete for the purpose of regulating resistance training. Such tools include physiological, performance, and psychological monitoring that provide information before, during and after training. It is hoped by the end of the article that the reader understands the utility of the various methods available to enhance their training prescription. Additionally, this review identifies novel practices in resistance training regulation deserving of future exploration.
Methods
To inform this narrative review, PubMed, Medline, SPORTDiscus, Scopus and CINAHL electronic databases were searched online in addition to hand and reference searching. Subject area in the Scopus database was limited to “medicine” and “health professions” with only “articles”, “reviews” and “articles in press” included in the search parameters. The search string: (resistance OR strength OR weight) AND training AND (autoregulat* OR auto-regulat* OR auto regulat*) OR monitor* AND athlet* was used for initial selection of manuscripts while limiting database results to peer reviewed studies of human subjects in English.
Once all manuscript records were obtained, initial screening consisted of: (i) screening for duplicates; (ii) screening titles for relevance; (iii) screening the abstracts for relevance; (iv) screening the full paper for inclusion criteria; and, (v) reviewing the references of the included papers to find any additional relevant publications that were not included previously. For a study to be included, the researchers must have: either investigated methods of athlete monitoring which were or could be used for resistance-training regulation, or investigated a training system or periodisation paradigm in which training was autoregulated; and/or, defined as an approach in which ongoing adjustments of a training variable (i.e. frequency of training, load selection, load progression, etc.) were systematically embedded into a protocol. If any papers were added that were found through reference checking or manual searching, they were subjected to the same screening process as if they had been found in the initial database search. Manuscripts that were not from peer reviewed journals were excluded.
While the full breadth of the included literature was reviewed and interpreted, some quantitative data was tabulated to better inform the reader. Specifically, correlations between measures of resistance training performance and monitoring variables were tabulated if the correlations were of a “strong” value of 0.68 (Taylor 1990) or higher (studies with correlations below this cut-off were not tabulated, but were discussed qualitatively in the body of text). Pearson correlation coefficients (r) were calculated by determining the square root of coefficient of determination scores (r2) when they were reported rather than r scores. If r or r2 scores were presented at multiple time points between the same variables, the correlation was presented as ≥ to the lowest score. When correlational data was presented in a case series, the mean correlation from all participants was reported only for relationships that were significant across all participants.
This review is presented in a narrative format due to the heterogenous nature of the included methods, such that it would be inappropriate to compare variables across studies. The purpose of this review is to provide an overview of the body of knowledge, avenues for future research, new perspectives in training theory, and to establish a framework for future experimental studies on autoregulation in resistance training.
Results
A flow chart diagram of the search selection process and articles included in this review is shown in Figure 1. Upon viewing the included articles, certain themes emerged which represent the major sections within the discussion. The major sections are organised by monitoring method to include; physiological, perceptual, and performance-based measures. For each major section Tables 1, 2 and 3 respectively, display r scores denoting the relationships between the monitored variable/s and resistance training performance (One Repetition Max [1RM], volume performed, maximum repetitions performed, etc.) reported. Additionally, sub-sections in each major section are organised by specific categories of physiological, performance and perceptual monitoring variables where appropriate.
Figure 1.
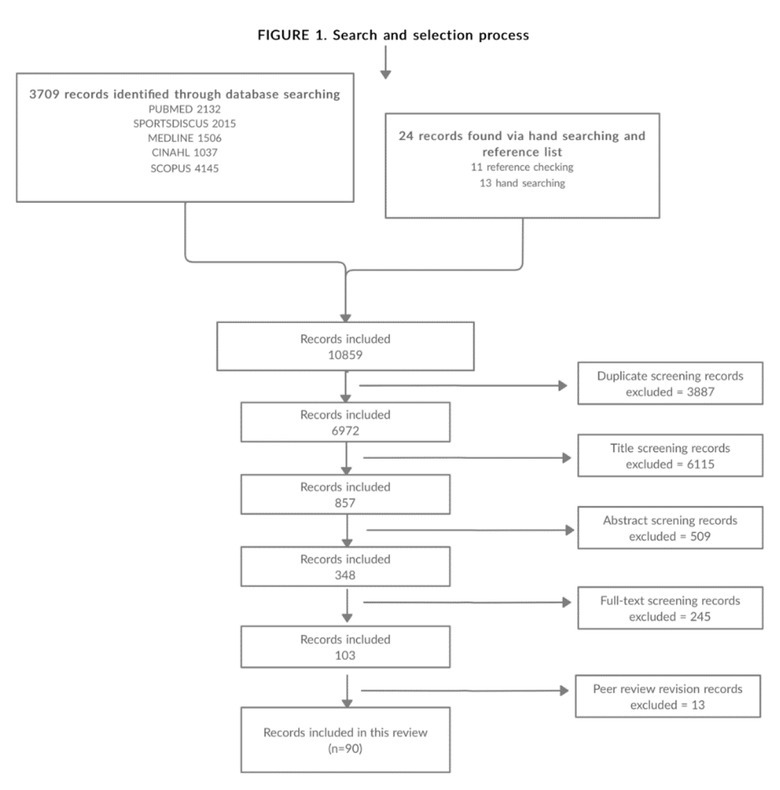
Search and selection process.
Table 1.
Physiological correlations with resistance training performance.
| Study | Population | Correlating variable | Training variable | r score |
|---|---|---|---|---|
| Cook et al., (2013) | Elite F netball players | Salivary T | Bench press VL | 0.84 |
| Crewther et al., (2010) | M weightlifters | Salivary T | SN 1RM | 0.70 |
| Fry et al., (1994) | Trained M | Post-exercise E %Δ | ISO leg extension %Δ after RT | ≥ 0.90 |
| Post-exercise NE %Δ | ISO leg extension %Δ after RT | ≥ 0.94 | ||
| Post-exercise NE %Δ | Smith squat 1RM %Δ after OT | -0.72 | ||
| Fry et al., (1998) | Trained M | T, free and total T/C ratio Δ | Smith squat 1RM Δ after OT | -0.72 |
| Fry et al., (2000) | Elite M weightlifters | Pre-exercise T/C ratio %Δ | SN + C&J 1RM %Δ after NV RT | 0.92 |
| M weightlifters | Pre-exercise T/C ratio %Δ | SN + C&J 1RM %Δ after NV RT | -0.71 | |
| Gonzalez-Badillo et al., (2017) | Trained M | T %Δ | Smith squat % velocity loss | 0.70 |
| Belcher et al., (2019) | Trained M | cfDNA | Deadlift ACV 96 hours post | 0.69 |
M = male; F = female; T = testosterone; C = cortisol; E = epinephrine; NE = norepinephrine; ISO; isometric; SN = snatch; C&J = clean and jerk; RT = resistance training; 1RM = 1-repetition maximum; VL = volume load; OT = over training; NV = normal volume; cfDNA = cell-free DNA; ACV = average concentric velocity.
Table 2.
Physical performance correlations with resistance training performance.
| Study | Population | Correlating variable | Training variable | r score |
|---|---|---|---|---|
| Carlock et al., (2004) | M weightlifters | CMJ, SJ PP | SN, C&J 1RM | ≥0.90 |
| 1RM squat | SN, C&J 1RM | ≥0.93 | ||
| F weightlifters | CMJ, SJ PP | SN, C&J 1RM | ≥0.76 | |
| 1RM squat | SN, C&J 1RM | ≥0.79 | ||
| Channell et al., (2008) | M young athletes | Jump height | PC 1RM/BW | 0.75 |
| PC 1RM/BW | Squat 1RM/BW | 0.88 | ||
| Cronin et al., (2004) | F netball players | Chest pass distance | Smith bench max strength | 0.71 |
| González-Badillo et al., (2010) | Trained M | Mean velocity 30-95% 1RM | 1RM | 0.99 |
| González-Badillo et al., (2017) | Young trained M | Reps performed as load increased (50-85% 1RM) | Bench press failure sets | 0.99 |
| MPV loss as load increased (50-85% 1RM) | Bench press failure sets | 0.98 | ||
| Estimated % reps performed after MPV loss (50-85% 1RM) | Bench press failure sets | ≥0.98 | ||
| Loturco et al., (2017) | M elite athletes | MPV 40-100% 1RM | Bench press, smith bench max strength | ≥0.98 |
| Murphy et al., (1995) | Trained M | Bench press ISOPF 90° | Bench press 1RM | 0.78 |
| Rodriguez Rosell (2019) | Young trained M | MPV loss | % performed reps on 4 squat and bench press loads | ≥0.96 |
| MPV loss | Acute fatigue after squat and bench press to failure | ≥0.97 | ||
| Shetty (1990) | M/F weightlifters | Leg and Back MVIC | SN, Jerk 1RM | ≥0.72 |
| Vizcaya et al., (2009) | M weightlifters | DSJ, SJ, CMJ height | SN, C&J 1RM, Sinclair total | ≥0.69 |
M = male; F = female; CMJ = counter movement jump; SJ = squat jump; DSJ; deep squat jump; SN = snatch; C&J = clean and jerk; PC = power clean; 1RM = 1-repetition maximum; BW = body weight; PP = peak power; ISOPF = isometric peak force; MVIC = maximum voluntary isometric contraction; MPV = Mean Propulsive Velocity. Sinclair total is a relative strength score in Olympic weightlifting to compare performance across weight classes (Sinclair 1985).
Table 3.
Perceptual correlations with resistance training performance
| Study | Population | Correlating variable | Resistance training variable | r score |
|---|---|---|---|---|
| Hackett et al., (2012) | M bodybuilders | Estimated RIR | Actual RIR | ≥ 0.93 |
| Mean CR-10 RPE | Actual RIR | ≥ −0.94 | ||
| Testa et al., (2012) | Trained M/F | Mean CR-10 RPE | VL relative to MNR capacity | ≥ 0.81 |
| Zourdos et al., (2016) | Trained M/F | RIR-based RPE | Mean squat velocity | -0.88 |
| Novice M/F | -0.77 | |||
| Graham & Cleather (2019) | Trained M | Session RPE | Front squat intensity | 0.71 |
| Back squat intensity | 0.85 |
M = male; F = female; RIR =repetitions in reserve; CR-10 = Category ratio one to ten; RPE = rating of perceived exertion; VL = volume load; MNR =maximum number of repetitions.
Physiological
Measuring the physiological status of an athlete is a commonly recommended approach to optimise future training (Davison et al., 2009). Additionally, monitoring physiological markers is a proposed method of detecting the presence of non-functional overreaching or overtraining (Meeusen et al., 2013). Depending on the time needed to analyse the data collected, physiological markers can theoretically be used to predict readiness to train. Likewise, the data can be analysed retrospectively to assess the effectiveness of training, and the results can be used to modify subsequent micro (e.g. daily - weekly), meso (e.g. weeks - months) or macrocycles (e.g. months – years) of training. This section will cover studies that investigated physiological responses that are performance independent such as the various hormonal biomarkers which may indicate adaptation and recovery.
Hormonal biomarkers
Assessing the exercise-induced hormonal response of an individual is a commonly used method to quantify training stress in a research setting. However, there are inherent difficulties associated with using serum and/or plasma hormones and other biochemical markers to monitor and predict performance. The use of such physiological indices requires expert laboratory analysis that can be prohibitively costly if used on a regular basis, and depending on how the biological samples are collected, can be inappropriately invasive for regular use. In addition, due to the sample collection and processing time, no immediate modification of training variables can be performed based upon the obtained results. Thus, while biochemical analysis is a potential method of athlete monitoring, these issues draw into question the practicality of taking blood samples to assess markers for recuperation and readiness to train. That said, one potential method that avoids some of these issues, is salivary hormone analysis (Papacosta and Nassis 2011).
In one of the few studies of female athletes meeting this review’s inclusion criteria, Cook and colleagues (2013) reported the relationship between pre-training salivary testosterone levels and performance in 12 national netball players with at least 3 years of structured and progressive strength training experience. They reported that salivary testosterone levels were significantly related to relative voluntary workload in the back squat (r2 = 0.45, p = 0.02) bench press (r2 = 0.70, p < 0.001), and medicine ball throw distance (r2 = 0.50, p = 0.01). Nunes et al., (2011) reported moderate correlations (r = 0.58 to 0.65, p = 0.02 to 0.05) between the change in salivary testosterone and the change in half squat, bench press and biceps curl 1RM among elite female basketball players. Crewther and Cook (2010) observed a similar trend in four male Olympic weightlifters, noting their pre-workout salivary testosterone concentrations significantly related to the snatch, clean and jerk and Olympic total (r = 0.62 to 0.70, p < 0.01 to 0.05). However, in the four female lifters in this study there was no significant relationship observed between pre-workout salivary testosterone and performance in the snatch or clean and jerk (r = 0.01 to 0.09) (Crewther and Christian 2010). Similar research has also been performed with elite rugby players by Crewther and colleagues (2009). However unlike the aforementioned studies, significant relationships between testosterone and 1RM strength and allometrically scaled strength were not observed (Crewther et al., 2009). A potential reason strong relationships between salivary testosterone and strength are shown in some studies while others show no relationship at all, are differences in strength. It appears that when segregated by squat strength (those ≤ 1.9x bodyweight and those ≥ 2x bodyweight), stronger athletes display a much higher correlation (r = 0.92, p < 0.01) between salivary testosterone and 1RM than weaker athletes (r = 0.35, p > 0.05) (Crewther et al., 2012).
Beyond differences due to subject characteristics, there is conflicting evidence regarding the validity of salivary testosterone analysis. While some reviews conclude that salivary testosterone is a valid and reliable representation of serum free testosterone levels (Papacosta and Nassis 2011), not all research in this area is in agreement. Cadore and colleagues (2008) reported very weak and non-significant correlations between salivary and blood testosterone (r = 0.22 to 0.26, p > 0.05). In another study the authors reported free testosterone to be very well represented by salivary testosterone measures in men (r = 0.92, p < 0.001) (Arregger et al., 2007). However, Youssef et al., (2010) reported that this relationship was substantially weaker in females (r = 0.52, p < 0.001). The inconsistent findings on the validity of salivary testosterone may be another reason for the reported discrepancies for performance prediction in the literature.
Unlike testosterone, salivary measures of cortisol appear to be more consistently representative of serum levels (Cadore et al., 2008; Lippi et al., 2009; Papacosta and Nassis 2011). As previously mentioned, while Crewther and colleagues observed no significant relationships between salivary testosterone and strength in elite rugby players, relationships between allometrically scaled box squat 1RM and salivary cortisol (r = 0.69, p < 0.05) and allometrically scaled and unscaled box squat 1RM with testosterone to cortisol ratio were observed (r = - 0.62 to -0.73, p < 0.01 to 0.05). However, these relationships appeared to be movement and position dependent as they only reached significance in backs but, not in forwards and only in the box squat and not the bench press (Crewther et al., 2009). McGuigan and colleagues (2004) found that while volume load was not related to salivary cortisol, the percentage change in salivary cortisol levels was moderately correlated (r = 0.54, p = 0.08) to squat 1RM relative to bodyweight in resistance-trained males and females. In contrast, changes in salivary cortisol had a moderate negative relationship (r = -0.63, p = 0.08) with front squat 1RM among male and female weightlifters as reported by Crewther (2010).
Beyond training, there are mixed results as to the ability of salivary cortisol for predicting competition performance in strength athletes. Passelergue et al., (1995) found a moderately strong correlation (r = 0.67, p < 0.05) between competition performance and salivary cortisol levels in male weightlifters, while Crewther (2011) reported moderate correlations (r = 0.48 to 0.49, p < 0.05) for the competition lifts in male and female weightlifters during simulated competition, which disappeared in actual competition. Similarly, Le Panse (2010) found no significant correlation between cortisol and competition bench press results among male and female elite powerlifters.
Overall, there appears to be a high level of variability and inconsistency regarding the use of pre and post workout levels of, changes in, and the ratio between testosterone and cortisol as a predictive tool to monitor and regulate performance. In many cases, disparate results between males and females (Crewther and Christian 2010), athletes of different competitive levels (Fry et al., 2000), athletes of different 1RM strength level (Crewther et al., 2012), positions within a sport (Crewther et al., 2009), actual versus simulated competition (Crewther, Taati, and Keogh 2011), exercises (Crewther et al., 2009) and correlational direction (positive or negative) (Crewther and Christian 2010; McGuigan, Egan, and Foster 2004) are reported. Therefore, while the invasiveness associated with blood collections can be avoided by salivary measurements, the time spent and expertise needed for analysis and the variability between and within studies, draws into question the practical utility of hormonal analyses as a training monitoring tool. Overall, the use of testosterone and the testosterone cortisol ratio, in well-trained male athletes seems to most consistently mirror training load or predict performance; however, these markers may also prove reliable in women with additional study. Thus, if coaches can afford to collect these markers, can establish their reliability, and have the expertise and facilities to analyse them in a time efficient manner, they could be used to retrospectively assess the stimulus-recovery balance of a training cycle to make adjustments to subsequent training.
Muscle damage biomarkers
In addition to changes in hormonal biomarkers, muscle damage is proposed as a relevant biomarker for monitoring training (Baird et al., 2012). However, markers of muscle damage may be inappropriate in isolation as they cannot provide information on a central fatigue (Fahey 1997). For example, creatine kinase (CK) is one of the most commonly used biomarkers for muscle damage; however, it is not truly representative of exercise induced muscle damage as CK levels may be influenced by various factors such as ethnicity, hydration status and CK clearance rate within the muscle itself (Baird et al., 2012).
While CK does moderately correlate (r = 0.45 to 0.55, p = 0.01 to 0.05) to the amount of resistance training volume performed (Machado et al., 2012), this correlation may not be indicative of how much volume can or should be performed. Specifically, the causative relationship between adaptive skeletal muscle remodelling and muscle damage is disputed (Damas et al., 2016). Additionally, the repeated bout effect attenuates the muscle damage response to exercise and is impacted by the volume, contraction type, familiarity with the exercise and frequency of its performance (Zourdos et al., 2015). Recently, Belcher and colleagues investigated the time course recovery of the squat, bench press and deadlift and found that despite the recovery of peripheral CK and lactase dehydrogenase (LDH), another proxy marker of muscle damage - acute concentric velocity in the squat - remained significantly decreased for 72 hours (Belcher et al., 2019). The researchers also found that elevations in cell-free DNA (cfDNa) were associated with increases or attenuated rates of decline in average concentric velocity (ACV) in the squat, bench press and deadlift. However, the authors also noted that additional studies are required as there seems to be conflicting relationships between cfDNa and ACV following resistance exercise (Velders et al., 2014; Andreatta et al., 2018). Therefore, muscle damage response may not be appropriate for determining an optimal training dose, as some of these factors are not necessarily related to time course of recovery or adaptive capacity.
There are a large number of muscle damage biomarkers which can be measured (Brancaccio, Lippi, and Maffulli 2010). However, there is variability between studies, non-standardised procedures, measurement confounders, and unclear relationships between muscle damage and performance. Further, the fact that cheaper and easier to implement methods of subjective monitoring appear to better mirror training loads, suggests muscle damage markers at best have utility for regulating resistance training only when used alongside other monitoring methods (Baird et al., 2012; Saw et al., 2016; Fahey 1997).
Performance
Performance in and of itself can be a useful tool for monitoring resistance training. Unlike team sports, in strength sports such as Olympic weightlifting, powerlifting and strongman, the competition lifts can be directly replicated and tested in training. Typically, maximal strength testing is performed at the beginning of a training cycle for load prescription, and at the end of a training cycle to assess its effectiveness (Seo et al., 2012). However, this approach only allows for retrospective analysis and may not provide feedback frequently enough to optimise training. While well-trained lifters can perform 1RMs with a high degree of reliability (CV = 1.7-3.6%) (McGuigan and Kane 2004), novice lifters can increase their 1RMs quite rapidly due to neuromuscular adaptations and the learning effect of testing and thus, tests may not represent their true maximal strength (Jovanović and Flanagan 2014). This draws into question the validity of basing training on a percentage of 1RM in these populations. Additionally, regularly testing competition 1RMs can be problematic even in well trained lifters. Strength gains may be optimised in trained populations when relative load, on average, reaches 80-85% of 1RM (Peterson et al., 2004, 2005). However, there is data indicating that as the proportion of lifts exceeding 90% of 1RM increases past a given point, strength gains attenuate, (Gonzalez-Badillo et al., 2006), potentially caused by increased fatigue from heavy loading. Additionally, there is some evidence that if form breakdown occurs, the risk of injury is higher when lifting heavy (≥ 90% 1RM) loads (Spencer and Croiss 2015). While repetition maximum (RM) testing (i.e. maximal load capacity when performing 3, 5 or 10 repetitions, etc.) allows for a reduction in the peak mechanical strain on the body compared to 1RM testing, training to failure on a regular basis can be counterproductive as it can induce unnecessary fatigue and metabolic strain without an added benefit to performance when compared to a submaximal approach (Izquierdo et al., 2006; Davies et al., 2016). Therefore, there is interest in studying less taxing forms of performance that could be tested more frequently that are thought to reflect improvements in competition lifts (Vizcaya et al., 2009; Carlock et al., 2004).
Predictive performance measures
Several research groups investigated whether jump performance can predict performance of the Olympic lifts and their derivations (Vizcaya et al., 2009; Channell and Barfield 2008; Carlock et al., 2004). Jump testing requires far less time than 1RM testing and is also arguably less mentally or physically fatiguing. Further, predictive measures can provide information on how recovered the athlete is from previous sessions, as well as give insight on their readiness to perform on the given day. This then allows for adjustments to the present day’s training to ensure overtraining does not occur while still providing an adequate stimulus (i.e. autoregulation). While Carlock et al., (2004) reported strong relationships (r ≥ 0.76) for peak power output in the counter-movement and squat jump with Olympic weightlifting performance in both male and female Olympic weightlifters (Table 2), measurements of jump height also appear to predict performance (Vizcaya et al., 2009; Channell and Barfield 2008) and requires less expensive equipment and technical expertise. While strong correlations are reported between countermovement, deep squat and squat jump height with snatch and clean and jerk performance (Vizcaya et al., 2009), the highest correlations within individual studies are typically found when taking bodyweight into account. Specifically, Vizcaya and colleagues (2009) found that out of all tested correlations, the deep squat jump correlated highest (r ≥ 0.76) with the Sinclair total (an equation for strength relative to bodyweight used in Olympic weightlifting (Sinclair 1985). Likewise, Channell et al., (2008) reported their highest correlation (r = 0.88) for jump height with power clean 1RM relative to body mass. Additionally, decrements in vertical jump (VJ) height were correlated with the decrement in back squat volume performed (r = 0.65) (Watkins et al., 2017). Specifically, BRUNEL Mood Assessment (BAM) and VJ were measured before and after two fatiguing lower body sessions within 48 hours of each other, consisting of hang cleans, push presses, Romanian deadlifts, leg presses and four sets to failure in the back squat. A ~2.5 cm decrease in VJ height corresponded to a ~5.5 repetition decrease in back squat volume after a fatiguing workout. Therefore, VJ height assessment could be used as a tool to measure readiness for back squat training after high volume, fatiguing resistance exercise.
Limited study of the predictive ability of other peak power output tests on exercise performance has occurred outside of jumps and Olympic weightlifting. For example, medicine ball chest pass distance was reported to strongly correlate (r = 0.71) with maximal Smith machine bench press strength (Cronin and Owen 2004). Other lab-based kinetic measures have also correlated to resistance training performance. Maximum voluntary isometric contractions of the leg and back musculature are predictive (r = 0.720.84) of snatch and jerk 1RM (Shetty 1990) and 90 degrees isometric bench press peak force can predict (r = 0.78) bench press 1RM (Murphy et al., 1995) in well trained lifters (these relationships may be weaker without technical proficiency in the exercises in question). While electromyography and force measurements are typically prohibitive due to the cost and expertise needed, measuring barbell velocity is an emerging possibility for field use. Mean concentric velocity is highly predictive of strength (Table 2) as per the load-velocity relationship. As a lifter approaches the maximal number of repetitions they can perform during a set, velocity will slow until they reach failure or zero velocity (González-Badillo and Sánchez-Medina 2010). Thus, it is proposed that volume could be regulated by the maintenance of velocity or peak mechanical power output or that load could be individually prescribed based on a velocity profile (González-Badillo and Sánchez-Medina 2010). Indeed, authors of a review on velocity-based training (VBT) describe how an individualised velocity profile can be conducted with 5 sub maximal sets between 30-85% of 1RM without the need to test the individual’s 1RM (Jovanović and Flanagan 2014). This profile can be used to prescribe load based on velocity as opposed to a percentage of 1RM. Due to the stable relationship between velocity and percentage of 1RM, VBT allows for session-to-session load autoregulation. Thus, VBT avoids the issue of a prescribed load being too easy or difficult due to acute arousal or fatigue, respectively (or atypical arousal or fatigue during a 1RM pre-test), that can occur with percentage based training.
Recently, researchers investigated a system by which volume could be autoregulated based on thresholds for velocity decay. Specifically, two groups were compared, one which ceased performing repetitions within a set when the initial velocity decreased by 40% and another which ceased repetitions after a 20% velocity decay. More volume, and subsequently greater hypertrophy, was generated in the 40% group, while less volume and greater improvements in jump height occurred in the 20% group (Pareja-Blanco et al., 2017). In addition, Rodriguez-Rosell and colleagues (2019) examined the relationship of velocity loss and repetitions in reserve in the back squat and bench press. A single set to failure was performed for both exercises with four different relative loads (50%, 60%, 70%, and 80% of 1RM). A strong relationship was found between the relative loss of velocity and the completed amount of repetitions within the set across all four intensities. This provides novel data that set volume can be autoregulated based on the magnitude of velocity loss instead of a fixed number of repetitions with a given load.
Similarly, the time course of recovery following four different resistance exercise protocols in terms of loading magnitude (60% and 80% 1RM) and velocity loss (20% vs 40%) in the full squat exercise was established (Pareja-Blanco et al., 2017). A higher velocity loss during the set (40%) and a lower relative load (60% 1RM) resulted in greater fatigue and slower rates of recovery than lower velocity loss and higher relative load; therefore, intensity and level of effort are two key variables to regulate and monitor within a training program. Finally, mean velocity and peak power output were substantially higher with 10% of velocity loss when compared to 20% and 30% across multiple sets in the back squat (Weakley et al., 2019), suggesting velocity loss thresholds can be used to prescribe and monitor training loads as they allow for maintenance of desired performance characteristics and specific adaptations.
Velocity loss is a reliable method for monitoring the level of effort and training volume during resistance exercise. Specifically, velocity was collected while subjects performed eight tests of repetition maximums with loads ranging from 50-85% of 1RM in the bench press. González-Badillo and colleagues (2017) observed a very strong relationship between the percentage of mean propulsive velocity (MPV) loss in a set and the percentage of performed repetitions for loads between 50-85% of 1RM in the bench press. Furthermore, equations to predict the percentage of performed repetitions from relative velocity loss were determined. Thus, monitoring repetition velocity and using prediction equations to determine how many repetitions are left in reserve in a bench press set may be possible. Additionally, in a study of male athletes from different sports, MPV precisely determined free weight bench press and Smith machine bench press loading intensities from 40-100% 1RM (Loturco et al., 2017). Because MPV can precisely determine loading intensities and performance, monitoring fluctuations in daily strength and prescribing appropriate loading strategies may be possible with VBT. Research in VBT primarily involves the back squat and bench press; thus, its use is not well understood for other exercises and/or variations. Recently, Spitz and colleagues (2019) had subjects perform trials at maximal intended velocity with loads of 30, 50, 70, and 90% of 1RM for the back squat and front squat. Peak and mean velocities between these two lifts were similar; thus, VBT is likely a compatible tool for either squat variation.
Arguably more important than these reported relationships, are the preliminary studies examining longitudinal training adaptations. In a study of well-trained men, VBT led to significantly larger gains in bench press 1RM and CMJ as well as 50% larger improvements in strength in the squat, deadlift, and strict overhead press compared to percentage-based training after 6 weeks (Dorrell et al., 2019). Similarly, VBT produced significantly faster mean and peak velocities compared to PBT in well trained males (Banyard et al., 2019). While recent research shows the potential utility of VBT to individualise training and enhance performance, equipment is required for its implementation. Fortunately, the linear position transducers utilised to track velocity in the field are easy to use, and if they become more affordable and with the advent of smart phone applications which can reliably measure velocity (Balsalobre-Fernandez et al., 2017), VBT will likely become more accessible and used by athletes and practitioners.
Individualised load progression
Another performance-based method of autoregulating training, is to implement individualised load increases based on acute performance instead of using pre-established increases in load from week to week (Mann et al., 2010). In one such study, Mann investigated “autoregulatory progressive resistance exercise” (APRE), a system in which each exercise was performed for four sets, with the repetitions in the third and fourth sets performed until failure. A chart was consulted that dictated the load adjustment to the fourth set based on the number of repetitions achieved during the third set. If greater or fewer repetitions were performed than expected, the load for the fourth set was either increased or decreased according to the chart, respectively. This same process was then repeated based on the number of repetitions achieved on the final fourth set to determine the load to be used in the next training session (Mann et al., 2010). Interestingly, when comparing APRE to a linear periodised (LP) approach with Division I American football players during a 6-week training period, Mann and colleagues found that APRE resulted in greater improvements in 1RM bench press strength (APRE: 93.4 ± 103 N vs. LP: 20.40 ± 49.6 N; p = 0.02), estimated 1RM squat strength (APRE: 192.7 ± 199 N vs. LP: 37.2 ± 155 N; p = 0.05) and number of bench press repetitions performed to fatigue with a weight of 225 lb (APRE: 3.17 ± 2.86 vs. LP: -0.09 ± 2.40 repetitions; p = 0.02), compared to LP.
Based on the same concept, in a speculative review, Fairman and colleagues (2017) proposed the use of an APRE inspired, rating of perceived exertion (RPE) modified, individualised load progression approach. The authors recommended that increases or decreases in load could occur when sets were performed at a lower or higher RPE, respectively, than prescribed (Fairman et al., 2017). Likewise, in a study comparing volume matched, moderate-load, high-repetition resistance training to high-load, low-repetition training, Klemp et al., (2016) implemented an individualised approach to load increases in both groups based on the completion of the prescribed training from the previous week. Specifically, load increases were dependent on whether the individual completed the prescribed prior training, or was unable to complete all prescribed repetitions. If repetitions were missed, smaller load increases were implemented (Klemp et al., 2016). While both approaches were inspired by the to-failure APRE model, these modifications allow the concept to be applied without the requirement of training to failure.
Perceptual
Psychometric questionnaires and rating scales have long been used to assess readiness (Laurent et al., 2011) and recovery (Sweet et al., 2004) in athletes. Their ease of use, negligible cost, and versatility make them attractive options for training monitoring (Saw, Main, and Gastin 2016). Simple scores for rating perceived exertion can be obtained after sets (Testa et al., 2012), or after entire sessions (Day et al., 2004), and ratings for readiness can be recorded prior to sessions to predict performance (Sikorski et al., 2013) or even to alter training schedules (McNamara and Stearne 2010). Additionally, tracking fatigue and depression with psychometric questionnaires is one of the only methods of monitoring overtraining which is almost universally suggested due to its validity in mirroring training loads, ease of use and reliability (Fahey 1997; Foster 1998; Meeusen et al., 2013).
Subjective wellness scales
One such scale introduced by Laurent and colleagues (2011) called the perceived recovery status (PRS) scale is a way of monitoring athlete readiness. The PRS scale is essentially an inverted RPE scale from 0-10 whereby 10 signifies “very well recovered” and 0 signifies “very poorly recovered”. PRS scores of 0-2 indicate that the athlete or coach can expect reduced performance, with scores of 3-7 normal performance is expected, and with scores of 8-10 improved performance is expected. In this study, PRS scores were applied to repeated sprint training over 72 hours and the authors found post-warm up PRS scores were inversely associated with change in sprint times, i.e. faster sprints were moderately correlated with higher subjective ratings of readiness (r = -0.63, p < 0.01). When PRS scores were taken prior to warming up, this correlation fell to -0.41. More specific to the present review, Sikorski and colleagues (2013) examined the relationship between PRS scores and biomarkers of recovery and readiness 48 hours after a high volume bout of resistance training in trained participants. The authors reported that 58.6% of the variance in the muscle damage marker creatine kinase was explained by PRS scores (r2= 0.59, p < 0.05) and overall, moderate coefficients of determination were observed between muscle soreness in the legs, chest and arms respectively (r2 = 0.53, 0.29, 0.12, p < 0.05).
Questions remain, however, as to the utility of the PRS scale to predict acute performance. In a recent case series, PRS scores were moderately correlated with daily 1RM performance in two out of three well-trained competitive lifters. However, in one lifter this correlation was positive (r = 0.53, p < 0.05) as one might expect, while in the other lifter the correlation was actually negative (r = -0.39, p < 0.05) (Zourdos et al., 2015). In contrast to the inconsistent relationship between PRS and 1RM in this case series, significant relationships were reported for all three participants between the RPE score of their final warm up set at 85% 1RM and 1RM performance (r = -0.35-0.70, p < 0.05) (Zourdos et al., 2015). In this study, a relatively new RPE scale based on repetitions in reserve (RIR) was utilised, in which RPE scores are defined by how many additional repetitions the user believed they could have performed had they taken the set to failure (i.e. 7 RPE corresponds to 3 RIR, 8 RPE to 2 RIR, 9 RPE 1 RIR, etc.) (Zourdos et al., 2016). Thus, this preliminary data may indicate that RIR-based RPE scores of a final warm up set could be a more accurate predictor than PRS for acute force production.
Besides the PRS scale, usage of other forms of subjective scales have been employed to investigate the relationship between subjective well-being and counter movement jump (CMJ) to assess neuromuscular performance. Hills and Rogerson (2018) designed a custom questionnaire modelled on the questionnaire used by McLean and colleagues (2010) to evaluate neuromuscular performance in Rugby athletes. Sleep, fatigue, upper and lower body soreness, and mood all showed positive associations with CMJ peak velocity (r = 0.67, 95% CIs = 0.54-0.76, p < 0.01), when using this questionnaire. These results are similar to the research of Watkins and colleagues (2017) who showed a strong association in back squat performance with CMJ which is commonly used to measure neuromuscular fatigue. Hence, there could be value in using a subjective wellness questionnaire to assess and monitor ongoing neuromuscular fatigue/readiness, potentially used to modify session to session training.
Borg and RIR-based RPE
As discussed in the previous section, the “resistance training specific” RPE scale based on RIR (Zourdos et al., 2016) is a scale that measures intensity of effort on a scale of 1-10, based on proximity to failure within a set, called RIR. As discussed, velocity is a validated objective measure for intensity of effort (Jovanović and Flanagan 2014), and strong inverse correlations with barbell velocity and RPE (as load increases) in the squat and bench press has been reported in trained lifters (r = -0.77-0.88, p < 0.001) (Zourdos et al., 2016; Ormsbee et al., 2017). Additionally, because it is anchored to a quantitative value (RIR), the RIR-based RPE scale may be a more accurate scoring system for resistance training than the Borg category ratio 1 to 10 (CR-10) RPE scale (Borg 1982). This notion is based on the fact that lifters using the Borg scale have been shown to report submaximal RPE scores (6.8 to 8.1) even when taking sets to failure (Pritchett et al., 2009; Shimano et al., 2006). In one study, bodybuilders reported submaximal CR-10 scores when taking bench press and squat sets to failure (8.9-9.0 ± 0.70.8), yet their estimated RIR was within 0.63 repetitions from actual RIR (95% limits of agreements) (Hackett et al., 2012). Also, the ability to accurately gauge exertion using the traditional Borg RPE may be influenced to a greater degree by biological sex and athletic experience (Winborn et al., 1988; Barroso et al., 2014). Specifically, the more experience an athlete has, the more accurate ratings become (Barroso et al., 2014). Furthermore, in one study, inexperienced female athletes rated Borg RPE less accurately than inexperienced males; however, athletic exposure seemed to override these differences (Winborn et al., 1988). In contrast, authors of a recent study found when trained and untrained males and females performed the machine chest and leg press within 0 to 3 repetitions from failure, their predicted RIR error (i.e. the difference in the number of repetitions between predicted and actual) was less than one and did not significantly differ based on biological sex or experience (Hackett et al., 2016). However, some minor differences related to biological sex and experience do exist when using RIR. In the same study, when more than 3 repetitions from failure remained, males gauged RIR slightly more accurately than females (Hackett et al., 2016). It also appears novice lifters are less accurate when selecting back squat 1RM loads using the RIR-based scale compared to experienced lifters. However, this is likely caused by novice lifters’ inability to maintain neuromuscular control of heavy loads rather than a markedly poorer rating ability (Zourdos et al., 2016).
Recently, Helms and colleagues (2017) investigated if powerlifters can select loads to reach a self-rated targeted RPE. The investigators found that mean ‘RPE difference”, as calculated by RPE score – RPE target, were < 0.5 RPE from the target, indicating that Powerlifters perceive their load selections to accurately reflect their intended RPE upon set completion. In a more objective assessment, Zourdos and colleagues (2019) investigated the accuracy of intra-set RPE scores in the squat during a multiple repetition set, such that lifters reported an RPE between repetitions based on their perception of RIR throughout a set. The investigators found RIR predictions were more accurate when a set was taken closer to failure (9RPE), compared to further away from failure (7RPE), suggesting RIR-based RPE scores are best used when closer to failure during moderate to low repetition sets. Further, the participants accuracy was weakly, although not significantly correlated (r = -0.34 to -0.35; p = 0.09-0.10) to training age. This weak and nonsignificant relationship could be explained by the participants in Zourdos and colleagues’ study all having a training age greater than 2 years, differing from previous investigations of less trained individuals (Ormsbee et al., 2017; Hackett et al., 2016).
Besides using RPE to predict RIR and to autoregulate intensity of effort, RPE can also be used as a method to autoregulate training volume. Helms and colleagues (2018) had competitive powerlifters perform the squat and bench press 3x/wk and deadlift 2x/wk in a daily undulating format. Similar to the study performed by Parejo-Blanco and colleagues (2017), where a set was stopped when a velocity loss threshold was met, this study utilized a concept called an “RPE stop” in which the set was stopped when the prescribed RPE was reached or exceeded. Subjects were assigned to one of six RPE stop week orders (2%, 4%, 6%, or 4%, 6%, 2% or 4%, 2%, 6% etc.) and were required to perform a top set to a designated RPE followed by back off sets calculated based on which RPE stop week they were currently in. The lifters then had to perform sets with loads reduced by the designated percentage (2%, 4%, or 6%) until the RPE goal was met, exceeded, or not all repetitions were completed. The investigators found a higher RPE stop resulted in a predictable increase in training volume, allowing total training load to be autoregulated using an RPE stop system.
Beyond predictably regulating volume, the same investigators compared the utility of two resistance training protocols differing only in how load was prescribed (RPE vs % 1RM), while differences were nonsignificant, they observed small between-group effect sizes favouring the RPE load prescription group for 1RM strength gains (Helms et al., 2018). This was further validated by Graham and Cleather (2019) who compared changes in 1RM front and back squats between an autoregulated program (AR) using RIR against a fixed load training program (FL) using percentage 1RM across 12 weeks. Both groups improved their front squat and back squat after the intervention, but the autoregulated group had comparatively greater increases (p < 0.05) in their front squat (AR = 14.1kg, FL= 9.3kg) and back squat (AR = 15.2, FL = 9.1kg). Collectively, the evidence suggests the RIR-based RPE scale is a useful tool for prescribing and monitoring resistance training, and may facilitate greater strength gains compared to fixed-load protocols in trained lifters.
Overall, the greater accuracy observed when using RIR-based versus Borg RPE may be due to the differing definitions for scores between scales. Exercise “anchoring” (which is often not performed), whereby the researcher has the participant perform exercises at varying intensities and then verbally anchors RPE scores to each intensity, improves the accuracy of subsequent Borg RPE ratings (Pageaux 2016). Arguably, the Borg RPE scoring criterion such as “very hard” or “somewhat hard” are more reliant on anchoring because individuals of different demographics and with different backgrounds (i.e. athletic experience) may have differing perceptions of what constitutes these descriptions. However, the RIR-based scale may have less variability as scores are more objectively anchored based on the specific number of repetitions the user believes they can perform at the end of a set. This scale has also been used to autoregulate training load, volume and proven as an effective tool to increase strength.
Athlete-adjusted training configuration
Another use for subjective rating scales, is for altering training scheduling. In a study that more or less applied the PRS for daily load selection, McNamara and Stearne (2010) implemented a flexible non-linear model of training whereby members of a university weight training class could select either 10, 15 or 20RM loads for the day after rating their energy level on a 1 to 10 scale. The flexible training group made significantly greater strength improvements on an estimated 1RM leg press test when compared to a volume-matched group that performed a predetermined loading order (62 kg vs 16 kg; p = 0.02). Thus, while PRS was not explicitly studied, a 1 to 10 scale of readiness was used to guide daily training. Therefore, although it is unclear whether the PRS scale can accurately predict force production in trained lifters, based on the findings of McNamara and Stearne (2010), it may be a viable method of assessing readiness to train.
Supporting this notion, in a recent study trained males were split into groups, one performing an undulating protocol in a pre-set daily order of hypertrophy, power, and strength (HPS), while participants in a ‘flexible’ group were given the option to choose the order in which they wanted to perform sessions each week. Unlike McNamara and Stearne (2010), the flexible and HPS groups gained similar (p = 0.63) amounts of strength (increase in powerlifting total by 9.3% and 9.2%, respectively) (Colquhoun et al., 2016). This lack of difference is potentially explained by a recent investigation, in which participants using the HPS model performed more volume on strength days and increased 1RMs to a greater degree than a group performing sessions in the order of hypertrophy, strength and then power (Zourdos, et al., 2016); suggesting that there is little room to improve the HPS model when only intra-week adjustments are made (McNamara and Stearne allowed for adjustments throughout an entire mesocycle). With that said, even though performance was similar between groups, all participants in the flexible group completed the protocol while only 11 of 16 did so in the HPS group. Thus, it appears that a training protocol with a flexible schedule may improve adherence and will at least result in similar (Colquhoun et al., 2016), if not potentially greater strength gains (McNamara and Stearne 2010), compared to a pre-set protocol.
Session RPE
Another application of RPE in resistance training is the use of ‘session RPE’ (Day et al., 2004) originally introduced by Foster and colleagues (1995) in the study of endurance athletes. Session RPE is calculated by providing a 1-10 RPE rating using the Borg CR-10 scale 30 minutes after training to encapsulate perceived difficulty for the entire session. This rating is then used to represent internal training load by itself (Day et al., 2004; Sweet et al., 2004), or can be multiplied by the total repetitions (Lambert and Borresen 2010) or sets performed in a session (McGuigan et al., 2004). When using session RPE rating in isolation, scores mirror the load used in training without respect to the volume performed (Day et al., 2004; Sweet et al., 2004). Thus, it is has been recommended to multiply session RPE by the number of repetitions performed, and optionally to divide that by the amount of time the session took, to provide a measurement for internal training load that represents volume, intensity and density of training (Sweet et al., 2004).
Furthermore, McGuigan and Foster (2004) proposed session RPE could be used for more in depth resistance training monitoring. Specifically, session RPE multiplied by the number of sets (in the case of aerobic exercise, session duration) could be used to represent ‘training load’ for the day. Then, ‘training monotony’ (defined as the variability of training over a given time period) is determined by dividing the mean training load over a week by its SD. Finally, the product of training load and monotony can be used to calculate ‘training strain’ (Foster 1998), representing the overall stress experienced by the athlete. Importantly, higher levels of monotony and strain are associated with overtraining in athletes (Foster 1998); however, little research exists examining overtraining relationships with these variables when performing resistance training (Kiely 2012).
The original Borg 6-20 and CR-10 RPE scales (Borg 1970; Borg 1982), the modified OMNI RPE scale that includes a visual component (Robertson et al., 2003) and session RPE (Foster et al., 1995) appear to be reliable, representative of training load and physiological stress, and have therefore been suggested for training monitoring (Day et al., 2004; McGuigan and Foster 2004; Sweet et al., 2004). However, the application of RPE up to this point has primarily been as a post-set or post-session method of ensuring the prescribed external stress is matched internally with the experience of the athlete. Only recently has RPE, specifically the RIR-based scale, been suggested as a method for autoregulated load prescription (Zourdos, et al., 2016; Fairman et al., 2017). While this is an intriguing proposition, future research is required to assess the effectiveness of this approach.
Conclusions
A great deal of research examining methods of monitoring and regulating resistance training exists. Many of the biochemical monitoring methods are currently only appropriate for use within a research setting due to cost, time course for analysis, expertise required, or sample size needed for reliability. Other emerging physiological monitoring methods may eventually sidestep these issues; however, their application for resistance training has not yet been adequately studied (for example, heart rate variability). In contrast to the often difficult to use physiological methods, practical performance-based approaches to individualising training exist. Autoregulating load progression based on previous performance may result in greater strength gains than pre-determined progression models; and selecting an acute session-focus based on perceived readiness may also result in greater strength gain compared to rigid scheduling. Some field-based performance measurements appear to have utility for predicting competition lift 1RM strength. Specifically, bodyweight or light weight implement (such as a medicine ball chest pass) tests of maximal power may be usable as testing surrogates to avoid the fatigue and high mechanical loads associated with testing 1RM or repetitions to failure, if the athletes have a high technical proficiency and if a high test-retest reliability is established. Additionally, given the initial success of applying VBT for enhancing strength, and as the accessibility of velocity measurement technology improves, velocity-based autoregulation for both load and volume may become increasingly attractive approaches to individualising training. Given the ability of well-trained athletes to accurately gauge RIR, the high correlations between velocity and RIR-based RPE, and the preliminary training studies showing its use may enhance strength gains, this novel RPE scale may also have similar utility. While Borg and session RPE are useful for post-hoc monitoring, future research may reveal the RIR-based scale to have unique applications for autoregulatory training prescription much like velocity.
Practical implications
Given the above, many theoretical frameworks for monitoring and autoregulating resistance training can be developed and implemented. Such a framework could include pre-training assessments of readiness which could be used to keep, or modify the planned session for the day in a flexible training template. Such a decision, for example, could be based on jump height to determine volume capabilities on back squats or the predicted performance on the Olympic lifts, or a medicine chest ball pass for predicted performance on bench press. More globally, a 1-10 perceived readiness score following a warm up could be used to select a harder or easier session, or RIR-based RPE or velocity of the final warm up set could be used to determine whether a maximal strength, power, or volume-focused session should occur.
Following the selection of the daily training session, the load and/or volume could be adjusted based on an athlete’s capabilities on the day. For example, load could be selected such that the first repetition fell within the corresponding velocity range for a given percentage of 1RM, or the load could be assigned using a repetition target at a given RIR-based RPE score. Volume, either as number of repetitions per set or number of sets, could be autoregulated based on velocity or RPE stops. For example, a velocity range for the first repetition could be assigned, and the set could be stopped once ACV declined by a specific percentage (10-40%, per goal). Likewise, sets at a given repetition target could be assigned at an initial RPE, and once RPE increased on subsequent sets by a predetermined value, no further sets would be performed (e.g. sets of eight, with the initial set at 7RPE, continuing to do sets until a set was rated at a 9RPE or higher).
Following the completion of a mesocycle where sessions within each microcycle were determined or adjusted by readiness, and where intra-session load and volume were adjusted based on performance, the overall balance of stress, recovery, and adaptation could be assessed retrospectively. For example, average session RPE (either as a raw value or multiplied by the number of sets in a session) could be calculated for the mesocycle, and considered alongside the performance improvements or lack thereof of the athlete. If the average sessional RPE is high, and performance was stagnant or decreased, adjustments to the target RIR-based RPEs, velocity or RPE stops, or other variables to reduce volume or load could be implemented in the following mesocycle to hopefully reduce fatigue and allow for adaptation. Likewise, if the average sessional RPE is low, and performance was stagnant or decreased, the opposite adjustments could be made to increase training stress sufficiently to drive adaptation in the next mesocycle.
Ultimately, professionals can develop the most appropriate framework for their situation. We advise trainers and practitioners to select the monitoring and autoregulation tools discussed in this review which are the most practical given their budgetary, logistical and time constraints. In addition to practicality, we suggest utilising the approaches which are most representative of performance or training load. By doing so, trainers can improve the resistance training performance of even highly experienced athletes, who not only require a more individualised approach, but also careful balancing of their training stress and stimulus.
References
- Andreatta M. V.. Cell-Free DNA as an Earlier Predictor of Exercise-Induced Performance Decrement Related to Muscle Damage. Int J Sports Physiol Perform. 2018;13:953–56. doi: 10.1123/ijspp.2017-0421. et al. [DOI] [PubMed] [Google Scholar]
- Arregger A. L.. Salivary Testosterone: A Reliable Approach to the Diagnosis of Male Hypogonadism. Clin Endocrinol (Oxf) 2007;67:656–62. doi: 10.1111/j.1365-2265.2007.02937.x. et al. [DOI] [PubMed] [Google Scholar]
- Baird M. F. Creatine-Kinase- and Exercise-Related Muscle Damage Implications for Muscle Performance and Recovery. J Nutr Metab. 2012. et al. 2012. [DOI] [PMC free article] [PubMed]
- Baker D. G. 10-Year Changes in Upper Body Strength and Power in Elite Professional Rugby League Players--the Effect of Training Age, Stage, and Content. J Strength Cond Res. 2013;27:285–92. doi: 10.1519/JSC.0b013e318270fc6b. [DOI] [PubMed] [Google Scholar]
- Balsalobre-Fernandez C.. Validity and Reliability of a Novel Iphone App for the Measurement of Barbell Velocity and 1rm on the Bench-Press Exercise. J Sports Sci. 2017:1–7. doi: 10.1080/02640414.2017.1280610. et al. [DOI] [PubMed] [Google Scholar]
- Banyard H. G.. Comparison of the Effects of Velocity-Based Training Methods and Traditional 1rm-Percent-Based Training Prescription on Acute Kinetic and Kinematic Variables. Int J Sports Physiol Perform. 2019;14:246–55. doi: 10.1123/ijspp.2018-0147. et al. [DOI] [PubMed] [Google Scholar]
- Barroso R.. Perceived Exertion in Coaches and Young Swimmers with Different Training Experience. Int J Sports Physiol Perform. 2014;9:212–6. doi: 10.1123/ijspp.2012-0356. et al. [DOI] [PubMed] [Google Scholar]
- Bartholomew J. B.. Strength Gains after Resistance Training: The Effect of Stressful, Negative Life Events. J Strength Cond Res. 2008;22:1215–21. doi: 10.1519/JSC.0b013e318173d0bf. et al. [DOI] [PubMed] [Google Scholar]
- Beaven C. M., Cook C. J., Gill N. D.. Significant Strength Gains Observed in Rugby Players after Specific Resistance Exercise Protocols Based on Individual Salivary Testosterone Responses. J Strength Cond Res. 2008;22:419–25. doi: 10.1519/JSC.0b013e31816357d4. [DOI] [PubMed] [Google Scholar]
- Belcher D. J. Time Course of Recovery Is Similar for the Back Squat, Bench Press, and Deadlift in Well-Trained Males. Appl Physiol Nutr Metab. 2019. et al. [DOI] [PubMed]
- Borg G. Perceived Exertion as an Indicator of Somatic Stress. Scand J Rehabil Med. 1970;2:92–8. [PubMed] [Google Scholar]
- Borg G. A. Psychophysical Bases of Perceived Exertion. Med Sci Sports Exerc. 1982;14:377–81. [PubMed] [Google Scholar]
- Brancaccio P., Lippi G., Maffulli N.. Biochemical Markers of Muscular Damage. Clin Chem Lab Med. 2010;48:757–67. doi: 10.1515/CCLM.2010.179. [DOI] [PubMed] [Google Scholar]
- Bulbulian R.. The Effect of Sleep Deprivation and Exercise Load on Isokinetic Leg Strength and Endurance. Eur J Appl Physiol Occup Physiol. 1996;73:273–7. doi: 10.1007/BF02425487. et al. [DOI] [PubMed] [Google Scholar]
- Cadore E.. Correlations between Serum and Salivary Hormonal Concentrations in Response to Resistance Exercise. J Sports Sci. 2008;26:1067–72. doi: 10.1080/02640410801919526. et al. [DOI] [PubMed] [Google Scholar]
- Carlock J. M.. The Relationship between Vertical Jump Power Estimates and Weightlifting Ability: A Field-Test Approach. J Strength Cond Res. 2004;18:534–9. doi: 10.1519/R-13213.1. et al. [DOI] [PubMed] [Google Scholar]
- Channell B. T., Barfield J. P.. Effect of Olympic and Traditional Resistance Training on Vertical Jump Improvement in High School Boys. J Strength Cond Res. 2008;22:1522–7. doi: 10.1519/JSC.0b013e318181a3d0. [DOI] [PubMed] [Google Scholar]
- Colquhoun Ryan J. Comparison of Powerlifting Performance in Trained Males Using Traditional and Flexible Daily Undulating Periodization. J Strength Cond Res. 2016. et al. Published ahead of print. [DOI] [PubMed]
- Cook C. J., Beaven C. M.. Salivary Testosterone Is Related to Self-Selected Training Load in Elite Female Athletes. Physiol Behav. 2013;116-117:8–12. doi: 10.1016/j.physbeh.2013.03.013. [DOI] [PubMed] [Google Scholar]
- Crewther B. T., Christian Cook. Relationships between Salivary Testosterone and Cortisol Concentrations and Training Performance in Olympic Weightlifters. J Sports Med Phys Fitness. 2010;50:371–75. [PubMed] [Google Scholar]
- Crewther B. T.. Baseline Strength Can Influence the Ability of Salivary Free Testosterone to Predict Squat and Sprinting Performance. J Strength Cond Res. 2012;26:261–8. doi: 10.1519/JSC.0b013e3182185158. et al. [DOI] [PubMed] [Google Scholar]
- Crewther B. T.. Neuromuscular Performance of Elite Rugby Union Players and Relationships with Salivary Hormones. J Strength Cond Res. 2009;23:2046–53. doi: 10.1519/JSC.0b013e3181b73c19. et al. [DOI] [PubMed] [Google Scholar]
- Crewther B. T., Taati H., Keogh J. W. L.. The Effects of Training Volume and Competition on the Salivary Cortisol Concentrations of Olympic Weightlifters. J Strength Cond Res. 2011;25:10–15. doi: 10.1519/JSC.0b013e3181fb47f5. [DOI] [PubMed] [Google Scholar]
- Cronin J. B., Owen G. J.. Upper-Body Strength and Power Assessment in Women Using a Chest Pass. J Strength Cond Res. 2004;18:401–4. doi: 10.1519/12072.1. [DOI] [PubMed] [Google Scholar]
- Damas F.. Resistance Training-Induced Changes in Integrated Myofibrillar Protein Synthesis Are Related to Hypertrophy Only after Attenuation of Muscle Damage. J Physiol. 2016;594:5209–22. doi: 10.1113/JP272472. et al. [DOI] [PMC free article] [PubMed] [Google Scholar]
- Davison R. Richard, Ken A. Van Someren,, Andrew M. Jones. Physiological Monitoring of the Olympic Athlete. J Sports Sci. 2009;27:1433–42. doi: 10.1080/02640410903045337. [DOI] [PubMed] [Google Scholar]
- Day M. L.. Monitoring Exercise Intensity During Resistance Training Using the Session Rpe Scale. J Strength Cond Res. 2004;18:353–8. doi: 10.1519/R-13113.1. et al. [DOI] [PubMed] [Google Scholar]
- Dorrell H. F., Smith M. F., Gee T. I. Comparison of Velocity-Based and Traditional Percentage-Based Loading Methods on Maximal Strength and Power Adaptations. J Strength Cond Res. 2019. Published Ahead of Print. [DOI] [PubMed]
- Fahey T. D. Biological Markers of Overtraining. Biology of Sport. 1997;14:3–19. [Google Scholar]
- Fairman C. M.. A Scientific Rationale to Improve Resistance Training Prescription in Exercise Oncology. Sports Med. 2017;47:1457–65. doi: 10.1007/s40279-017-0673-7. et al. [DOI] [PubMed] [Google Scholar]
- Foster C. Monitoring Training in Athletes with Reference to Overtraining Syndrome. Med Sci Sports Exerc. 1998;30:1164–8. doi: 10.1097/00005768-199807000-00023. [DOI] [PubMed] [Google Scholar]
- Foster C.. Effects of Specific Versus Cross-Training on Running Performance. Eur J Appl Physiol Occup Physiol. 1995;70:367–72. doi: 10.1007/BF00865035. et al. [DOI] [PubMed] [Google Scholar]
- Fry Andrew C,. Relationships between Serum Testosterone, Cortisol, and Weightlifting Performance. J Strength Cond Res. 2000;14:338–43. et al. [Google Scholar]
- Gonzalez-Badillo J. J., Izquierdo M., Gorostiaga E. M.. Moderate Volume of High Relative Training Intensity Produces Greater Strength Gains Compared with Low and High Volumes in Competitive Weightlifters. J Strength Cond Res. 2006;20:73–81. doi: 10.1519/R-16284.1. [DOI] [PubMed] [Google Scholar]
- González-Badillo J. J., Sánchez-Medina L.. Movement Velocity as a Measure of Loading Intensity in Resistance Training. Int J Sports Med. 2010;31:347–52. doi: 10.1055/s-0030-1248333. [DOI] [PubMed] [Google Scholar]
- Gonzalez-Badillo J. J.. Velocity Loss as a Variable for Monitoring Resistance Exercise. Int J Sports Med. 2017;38:217–25. doi: 10.1055/s-0042-120324. et al. [DOI] [PubMed] [Google Scholar]
- Graham T., Cleather D. J. Autoregulation by "Repetitions in Reserve" Leads to Greater Improvements in Strength over a 12-Week Training Program Than Fixed Loading. J Strength Cond Res. 2019. [DOI] [PubMed]
- Hackett D. A. Accuracy in Estimating Repetitions to Failure During Resistance Exercise. J Strength Cond Res. 2016. et al. Published ahead of print. [DOI] [PubMed]
- Hackett D. A.. A Novel Scale to Assess Resistance-Exercise Effort. J Sports Sci. 2012;30:1405–13. doi: 10.1080/02640414.2012.710757. et al. [DOI] [PubMed] [Google Scholar]
- Helms E. R.. Self-Rated Accuracy of Rating of Perceived Exertion-Based Load Prescription in Powerlifters. J Strength Cond Res. 2017;31:2938–43. doi: 10.1519/JSC.0000000000002097. et al. [DOI] [PubMed] [Google Scholar]
- Helms E. R.. Rating of Perceived Exertion as a Method of Volume Autoregulation within a Periodized Program. J Strength Cond Res. 2018;32:1627–36. doi: 10.1519/JSC.0000000000002032. et al. [DOI] [PubMed] [Google Scholar]
- Helms E.R.. RPE vs. Percentage 1RM loading in periodized programs matched for sets and repetitions. Front Physiol. 2018;9:247. doi: 10.3389/fphys.2018.00247. et al. [DOI] [PMC free article] [PubMed] [Google Scholar]
- Helms E. R.. High-Protein, Low-Fat, Short-Term Diet Results in Less Stress and Fatigue Than Moderate-Protein Moderate-Fat Diet During Weight Loss in Male Weightlifters: A Pilot Study. Int J Sport Nutr Exerc Metab. 2015;25:163–70. doi: 10.1123/ijsnem.2014-0056. et al. [DOI] [PubMed] [Google Scholar]
- Hills S. P., Rogerson D. J.. Associatons between Self-Reported Well-Being and Neuromuscular Performance During a Professional Rugby Union Season. J Strength Cond Res. 2018;32:2498–509. doi: 10.1519/JSC.0000000000002531. [DOI] [PubMed] [Google Scholar]
- Hubal M. J.. Variability in Muscle Size and Strength Gain after Unilateral Resistance Training. Med Sci Sports Exerc. 2005;37:964–72. et al. [PubMed] [Google Scholar]
- Izquierdo Mikel,. Differential Effects of Strength Training Leading to Failure Versus Not to Failure on Hormonal Responses, Strength, and Muscle Power Gains. J Appl Physiol. 2006;100:1647–56. doi: 10.1152/japplphysiol.01400.2005. et al. [DOI] [PubMed] [Google Scholar]
- Jovanović Mladen, Flanagan Eamonn P. Researched Applications of Velocity Based Strength Training. J Aust Strength Cond. 2014;22:58–69. [Google Scholar]
- Kiely J. Periodization Paradigms in the 21st Century: Evidence-Led or Tradition-Driven? Int J Sports Physiol Perform. 2012;7:242–50. doi: 10.1123/ijspp.7.3.242. [DOI] [PubMed] [Google Scholar]
- Klemp A.. Volume-Equated High- and Low-Repetition Daily Undulating Programming Strategies Produce Similar Hypertrophy and Strength Adaptations. Appl Physiol Nutr Metab. 2016;41:699705. doi: 10.1139/apnm-2015-0707. et al. [DOI] [PubMed] [Google Scholar]
- Lambert M.I., Borresen J.. Measuring Training Load in Sports. Int J Sports Physiol Perform. 2010;5:40611. doi: 10.1123/ijspp.5.3.406. [DOI] [PubMed] [Google Scholar]
- Laurent C. M.. A Practical Approach to Monitoring Recovery: Development of a Perceived Recovery Status Scale. J Strength Cond Res. 2011;25:620–28. doi: 10.1519/JSC.0b013e3181c69ec6. et al. [DOI] [PubMed] [Google Scholar]
- Le Panse B.. Cortisol, Dhea, and Testosterone Concentrations in Saliva in Response to an International Powerlifting Competition. Stress. 2010;13:528–32. doi: 10.3109/10253891003743440. et al. [DOI] [PubMed] [Google Scholar]
- Lemmer J. T.. Age and Gender Responses to Strength Training and Detraining. Med Sci Sports Exerc. 2000;32:1505–12. doi: 10.1097/00005768-200008000-00021. et al. [DOI] [PubMed] [Google Scholar]
- Lippi G.. Measurement of Morning Saliva Cortisol in Athletes. Clin Biochem. 2009;42:904–6. doi: 10.1016/j.clinbiochem.2009.02.012. et al. [DOI] [PubMed] [Google Scholar]
- Loturco I.. Predicting the Maximum Dynamic Strength in Bench Press: The High Precision of the Bar Velocity Approach. J Strength Cond Res. 2017;31:1127–31. doi: 10.1519/JSC.0000000000001670. et al. [DOI] [PubMed] [Google Scholar]
- Machado M.. Creatine Kinase Activity Weakly Correlates to Volume Completed Following Upper Body Resistance Exercise. Res Q Exerc Sport. 2012;83:276–81. doi: 10.1080/02701367.2012.10599858. et al. [DOI] [PubMed] [Google Scholar]
- Mann J. B.. The Effect of Autoregulatory Progressive Resistance Exercise Vs. Linear Periodization on Strength Improvement in College Athletes. J Strength Cond Res. 2010;24:1718–23. doi: 10.1519/JSC.0b013e3181def4a6. et al. [DOI] [PubMed] [Google Scholar]
- McGuigan M. R., Egan A. D., Foster C.. Salivary Cortisol Responses and Perceived Exertion During High Intensity and Low Intensity Bouts of Resistance Exercise. J Sports Sci Med. 2004;3:8–15. [PMC free article] [PubMed] [Google Scholar]
- McGuigan M. R., Kane M. K.. Reliability of Performance of Elite Olympic Weightlifters. J Strength Cond Res. 2004;18:650–3. doi: 10.1519/12312.1. [DOI] [PubMed] [Google Scholar]
- McGuigan Michael R., Carl Foster. A New Approach to Monitoring Resistance Training. Strength Cond J. 2004;26:42–47. [Google Scholar]
- McLean B. D.. Neuromuscular, Endocrine, and Perceptual Fatigue Responses During Different Length between-Match Microcycles in Professional Rugby League Players. Int J Sports Physiol Perform. 2010;5:367–83. doi: 10.1123/ijspp.5.3.367. et al. [DOI] [PubMed] [Google Scholar]
- McLester J. R.. A Series of Studies--a Practical Protocol for Testing Muscular Endurance Recovery. J Strength Cond Res. 2003;17:259–73. doi: 10.1519/1533-4287(2003)017<0259:asospp>2.0.co;2. et al. [DOI] [PubMed] [Google Scholar]
- McNamara J. M., Stearne D. J.. Flexible Nonlinear Periodization in a Beginner College Weight Training Class. J Strength Cond Res. 2010;24:2012–7. doi: 10.1519/JSC.0b013e3181b1b15d. [DOI] [PubMed] [Google Scholar]
- Meeusen R.. Prevention, Diagnosis and Treatment of the Overtraining Syndrome: Joint Consensus Statement of the European College of Sport Science (ECSS) and the American College of Sports Medicine (ACSM) Eur J Sport Sci. 2013;13:1–24. doi: 10.1249/MSS.0b013e318279a10a. et al. [DOI] [PubMed] [Google Scholar]
- Murphy Aron J,. Isometric Assessment of Muscular Function: The Effect of Joint Angle. J Appl Biomech. 1995;11:205–15. et al. [Google Scholar]
- Nunes J. A.. Effects of Resistance Training Periodization on Performance and Salivary Immune-Endocrine Responses of Elite Female Basketball Players. J Sports Med Phys Fitness. 2011;51:67682. et al. [PubMed] [Google Scholar]
- Ormsbee M. J. Efficacy of the Repetitions in Reserve-Based Rating of Perceived Exertion for the Bench Press in Experienced and Novice Benchers. J Strength Cond Res. 2017. et al. Published ahead of print. [DOI] [PubMed]
- Pageaux B. Perception of Effort in Exercise Science: Definition, Measurement and Perspectives. Eur J Sport Sci. 2016;16:885–94. doi: 10.1080/17461391.2016.1188992. [DOI] [PubMed] [Google Scholar]
- Papacosta Elena,, George P. Nassis. Saliva as a Tool for Monitoring Steroid, Peptide and Immune Markers in Sport and Exercise Science. J Sci Med Sport. 2011;14:424–34. doi: 10.1016/j.jsams.2011.03.004. [DOI] [PubMed] [Google Scholar]
- Pareja-Blanco F.. Effects of Velocity Loss During Resistance Training on Athletic Performance, Strength Gains and Muscle Adaptations. Scand J Med Sci Sports. 2017;27:724–35. doi: 10.1111/sms.12678. et al. [DOI] [PubMed] [Google Scholar]
- Passelergue P., Robert A., Lac G.. Salivary Cortisol and Testosterone Variations During an Official and a Simulated Weight-Lifting Competition. Int J Sports Med. 1995;16:298–303. doi: 10.1055/s-2007-973009. [DOI] [PubMed] [Google Scholar]
- Peterson M. D., Rhea M. R., Alvar B. A.. Applications of the Dose-Response for Muscular Strength Development: A Review of Meta-Analytic Efficacy and Reliability for Designing Training Prescription. J Strength Cond Res. 2005;19:950–8. doi: 10.1519/R-16874.1. [DOI] [PubMed] [Google Scholar]
- Peterson M. D., Rhea M. R., Alvar B. A.. Maximizing Strength Development in Athletes: A Meta-Analysis to Determine the Dose-Response Relationship. J Strength Cond Res. 2004;18:377–82. doi: 10.1519/R-12842.1. [DOI] [PubMed] [Google Scholar]
- Pritchett Robert C,. Acute and Session Rpe Responses During Resistance Training: Bouts to Failure at 60% and 90% of 1rm. S Afr J Sports Med. 2009;21:23–26. et al. [Google Scholar]
- Robertson R. J.. Concurrent Validation of the Omni Perceived Exertion Scale for Resistance Exercise. Med Sci Sports Exerc. 2003;35:333–41. doi: 10.1249/01.MSS.0000048831.15016.2A. et al. [DOI] [PubMed] [Google Scholar]
- Rodriguez-Rosell D.. Relationship between Velocity Loss and Repetitions in Reserve in the Bench Press and Back Squat Exercises. J Strength Cond Res. 2019 doi: 10.1519/JSC.0000000000002881. et al. [DOI] [PubMed] [Google Scholar]
- Sarwar R., Niclos B. B., Rutherford O. M.. Changes in Muscle Strength, Relaxation Rate and Fatiguability During the Human Menstrual Cycle. J Physiol. 1996;493:267–72. doi: 10.1113/jphysiol.1996.sp021381. [DOI] [PMC free article] [PubMed] [Google Scholar]
- Saw Anna E, Luana C Main,, Paul B Gastin. Monitoring the Athlete Training Response: Subjective Self-Reported Measures Trump Commonly Used Objective Measures: A Systematic Review. Br J Sports Med. 2016;50:281–91. doi: 10.1136/bjsports-2015-094758. [DOI] [PMC free article] [PubMed] [Google Scholar]
- Seo Dong-il,. Reliability of the One-Repetition Maximum Test Based on Muscle Group and Gender. J Sports Sci Med. 2012;11:221–25. et al. [PMC free article] [PubMed] [Google Scholar]
- Shetty Anand B. Quantification of Selected Segmental Strengths in Weightlifting. J Strength Cond Res. 1990;4:37–41. [Google Scholar]
- Shimano T.. Relationship between the Number of Repetitions and Selected Percentages of One Repetition Maximum in Free Weight Exercises in Trained and Untrained Men. J Strength Cond Res. 2006;20:819–23. doi: 10.1519/R-18195.1. et al. [DOI] [PubMed] [Google Scholar]
- Sikorski E. M.. Changes in Perceived Recovery Status Scale Following High-Volume Muscle Damaging Resistance Exercise. J Strength Cond Res. 2013;27:2079–85. doi: 10.1519/JSC.0b013e31827e8e78. et al. [DOI] [PubMed] [Google Scholar]
- Sinclair R. G. Normalizing the Performances of Athletes in Olympic Weightlifting. Can J Appl Sport Sci. 1985;10:94–8. [PubMed] [Google Scholar]
- Spencer Kirsten,, Mathew Croiss. The Effect of Increasing Loading on Powerlifting Movement Form During the Squat and Deadlift. J Hum Sport Exerc. 2015;10:764–77. [Google Scholar]
- Spitz R. W.. Load-Velocity Relationships of the Back Vs. Front Squat Exercises in Resistance-Trained Men. J Strength Cond Res. 2019;33:301–06. doi: 10.1519/JSC.0000000000002962. et al. [DOI] [PubMed] [Google Scholar]
- Sweet T. W.. Quantitation of Resistance Training Using the Session Rating of Perceived Exertion Method. J Strength Cond Res. 2004;18:796–802. doi: 10.1519/14153.1. et al. [DOI] [PubMed] [Google Scholar]
- Taylor Richard. Interpretation of the Correlation Coefficient: A Basic Review. J Diagn Med Sonogr. 1990;6:35–39. [Google Scholar]
- Testa M., Noakes T. D., Desgorces F. D.. Training State Improves the Relationship between Rating of Perceived Exertion and Relative Exercise Volume During Resistance Exercises. J Strength Cond Res. 2012;26:2990–6. doi: 10.1519/JSC.0b013e31824301d1. [DOI] [PubMed] [Google Scholar]
- Timmons J. A. Variability in Training-Induced Skeletal Muscle Adaptation. J Appl Physiol. 2011;110:84653. doi: 10.1152/japplphysiol.00934.2010. [DOI] [PMC free article] [PubMed] [Google Scholar]
- Velders M.. Exercise Is a Potent Stimulus for Enhancing Circulating Dnase Activity. Clin Biochem. 2014;47:471–4. doi: 10.1016/j.clinbiochem.2013.12.017. et al. [DOI] [PubMed] [Google Scholar]
- Vizcaya F. J.. Could the Deep Squat Jump Predict Weightlifting Performance? J Strength Cond Res. 2009;23:729–34. doi: 10.1519/JSC.0b013e3181a04dc3. et al. [DOI] [PubMed] [Google Scholar]
- Watkins Casey M.. Determination of Vertical Jump as a Measure of Neuromuscular Readiness and Fatigue. J Strength Cond Res. 2017;31:3305–10. doi: 10.1519/JSC.0000000000002231. et al. [DOI] [PubMed] [Google Scholar]
- Weakley J.. The Effects of 10%, 20%, and 30% Velocity Loss Thresholds on Kinetic, Kinematic, and Repetition Characteristics During the Barbell Back Squat. Int J Sports Physiol Perform. 2019:1–23. doi: 10.1123/ijspp.2018-1008. et al. [DOI] [PubMed] [Google Scholar]
- Winborn Mark D, Meyers Andrew W, Carol Mulling. The Effects of Gender and Experience on Perceived Exertion. J Sport Exerc Psychol. 1988;10:22–31. [Google Scholar]
- Youssef Omnia,. Reliability of Salivary Testosterone Measurements in Diagnosis of Polycystic Ovarian Syndrome. East Fertil Soc J. 2010;15:183–87. et al. [Google Scholar]
- Zourdos M. C.. Efficacy of Daily One-Repetition Maximum Training in Well-Trained Powerlifters and Weightlifters: A Case Series. Nutr Hosp. 2015;33:437–43. et al. [Google Scholar]
- Zourdos M. C. Proximity to Failure and Total Repetitions Performed in a Set Influences Accuracy of Intraset Repetitions in Reserve-Based Rating of Perceived Exertion. J Strength Cond Res. 2019. et al. Published Ahead of Print. [DOI] [PubMed]
- Zourdos M. C.. The Repeated Bout Effect in Muscle-Specific Exercise Variations. J Strength Cond Res. 2015;29:2270–76. doi: 10.1519/JSC.0000000000000856. et al. [DOI] [PubMed] [Google Scholar]
- Zourdos M. C.. Modified Daily Undulating Periodization Model Produces Greater Performance Than a Traditional Configuration in Powerlifters. J Strength Cond Res. 2016;30:784–91. doi: 10.1519/JSC.0000000000001165. et al. [DOI] [PubMed] [Google Scholar]
- Zourdos M. C.. Novel Resistance Training-Specific Rating of Perceived Exertion Scale Measuring Repetitions in Reserve. J Strength Cond Res. 2016;30:267–75. doi: 10.1519/JSC.0000000000001049. et al. [DOI] [PubMed] [Google Scholar]