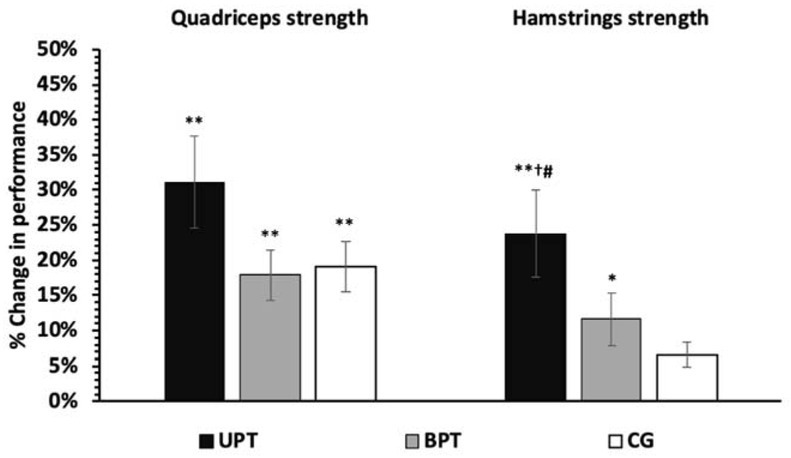
Figure 5.

Changes in maximal isometric strength of quadriceps and hamstrings performance for the unilateral plyometric training group (UPT), the bilateral plyometric training group (BPT) and the control group (CG). Values are expressed as means ± SE.
*: p<0.05 and **: p<0.01 from pre-training (baseline) values, †: p<0.05 between UBT and BPT and #: p<0.05 between the UPT and CG.
