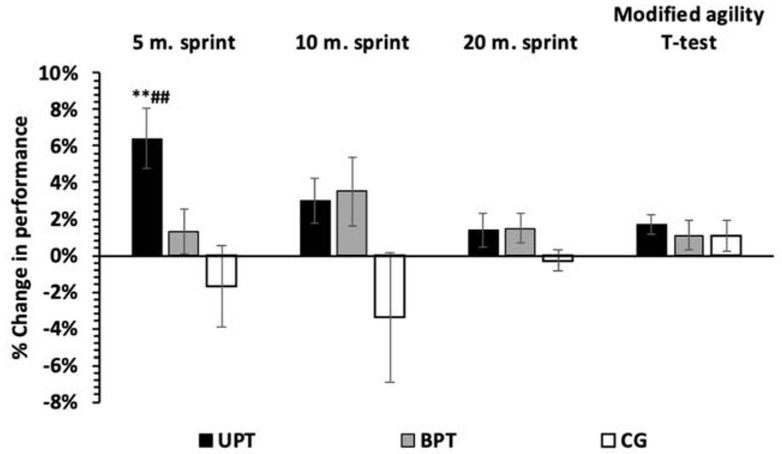
Figure 6.

Changes in 5 m, 10 m and 20 m sprints and the modified agility T-test performance for the unilateral plyometric training group (UPT), the bilateral plyometric training group (BPT) and the control group (CG). Values are expressed as means ± SE.
**: p<0.01 from pre-training (baseline) values and ##: p<0.01 between the UPT and CG
