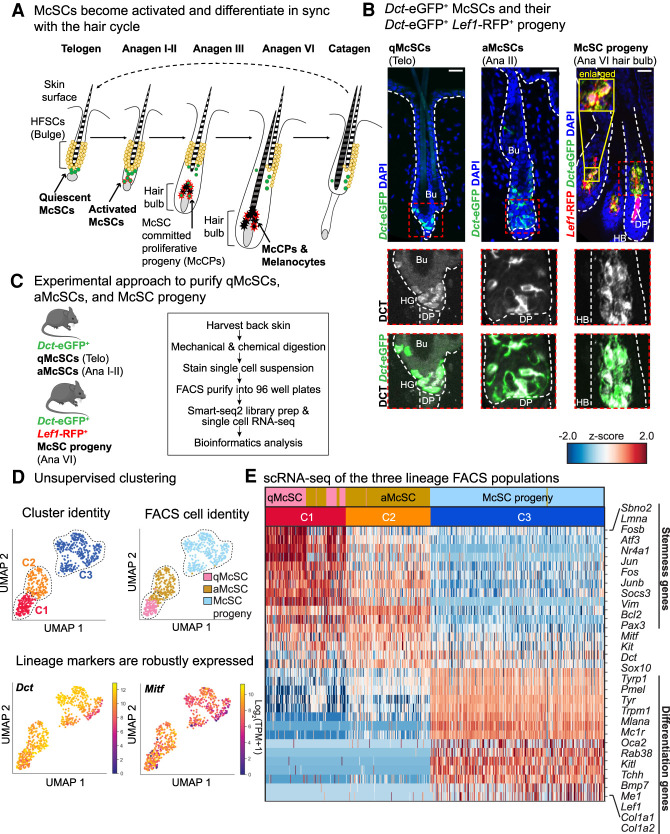
Figure 1.
McSCs and their progeny exhibit distinct transcriptional signatures during lineage progression. (A) Schematic of melanocyte lineage populations during bouts of quiescence, activation, and differentiation throughout the hair cycle. (B) IMF images of qMcSCs (left, second telogen [telo] approximately P60), aMcSCs (middle, anagen II [ana II] at P21), and hair bulb McSC progeny (right, anagen VI at P10). Scale bars, 25 μm. The white dashed line outlines HFs at the epithelial/mesenchymal junction, and the red dashed box indicates enlarged areas below. (Bu) Bulge. (C) Experimental approach used to isolate McSC lineage and perform transcriptional profiling. (D) UMAP representation and unsupervised k-NN-based clustering of single-cell data. Each dot represents a cell colored by its cluster (“C”) and known cell identity. For cell identity, pink dots are qMcSCs (n = 104 cells, n = 3 mice), gold dots are aMcSCs (n = 193 cells, n = 3 mice), and light-blue dots are hair bulb McSC progeny (n = 308 cells, n = 2 mice). (Below) Expression plots for the lineage markers, Dct and Mitf, across all three melanocyte populations. (E) Heat map illustrating differentially expressed genes between McSCs (C1 and C2) and McSC progeny (C3).

