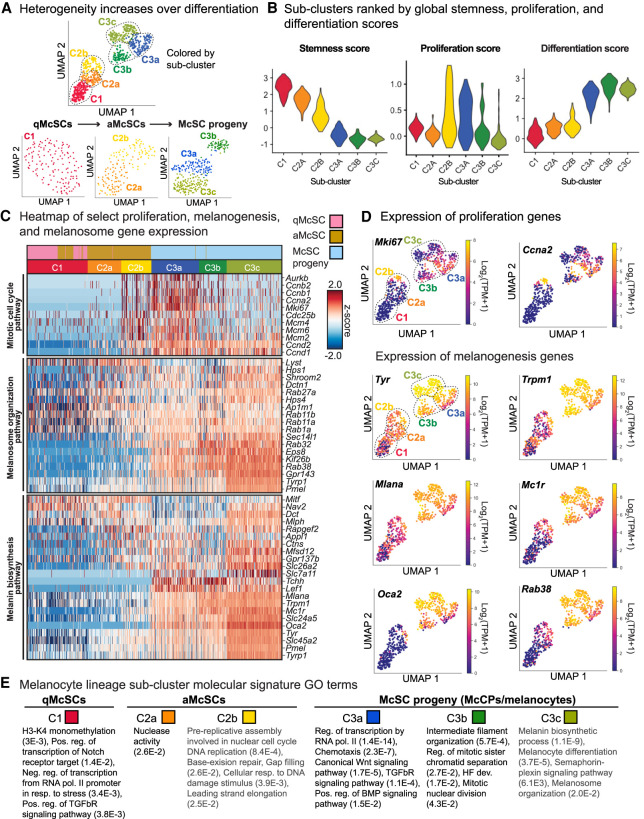
Figure 2.
Single-cell transcriptomes of melanocyte lineage cells suggests that heterogeneity increases during lineage progression. (A) Subclustering of each original cluster from Figure 1D. (B) Violin plots indicating stemness, proliferation, and differentiation scores throughout the six subclusters. (C) Heat map of select proliferation and melanogenesis mRNAs. (D) Expression plots of example proliferation genes and melanogenesis genes. (E) Selected GO terms for each subcluster with false discovery rate (FDR). See also Supplemental Tables S3–S6.

