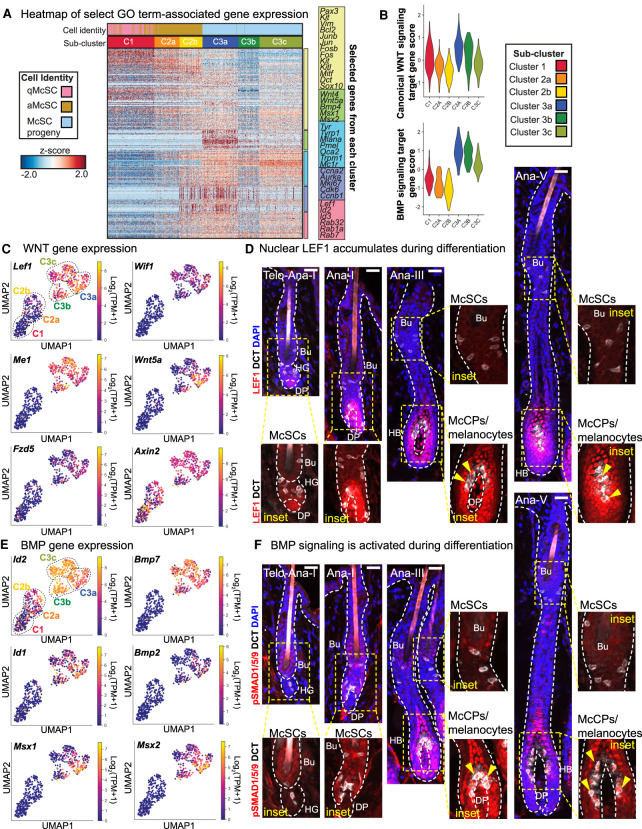
Figure 3.
WNT and BMP signaling increase during melanocyte differentiation. (A) Heat map of gene expression for select genes from GO terms in Figure 2E, including WNT and BMP signaling pathways. See also Supplemental Table S7. (B) Violin plots of canonical WNT and BMP target gene pathway scores in each subcluster. See also Supplemental Table S8. (C) Expression plots of WNT pathway genes. (D) IMF images showing LEF1 protein expression in the melanocyte lineage throughout hair cycling. Nuclear LEF1 (red) indicated by yellow arrows. (E) Expression plots of BMP pathway genes. (F) IMF images of melanocyte lineage populations in HFs throughout the hair cycle. pSMAD1/5/9 is absent in McSCs but becomes nuclear in McCPs/melanocytes (Mcs), indicated by yellow arrows. All scale bars, 25μm.

