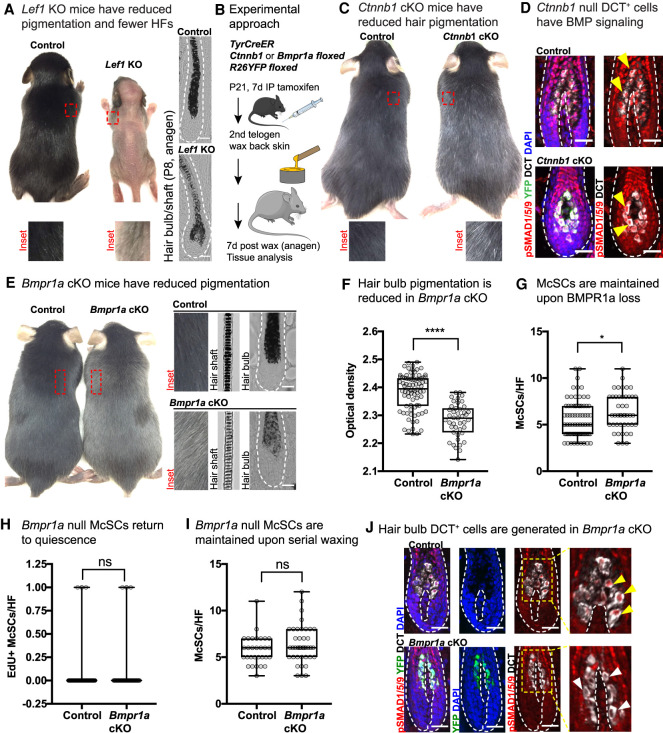
Figure 4.
Evidence that BMP signaling acts downstream from McSCs in lineage progression. (A) Representative phenotype of Lef1 KO mice at P13, when hair on the skin surface has emerged in KO (control littermate: female; Lef1 KO: male). Bright-field images of P8 anagen HFs shown at the left. (B) Experimental schematic for interrogating WNT and BMP pathways in the melanocyte lineage in vivo. (C) Representative phenotype of tamoxifen-treated TyrCreER Ctnnb1floxed R26YFP mice at second telogen. (D) IMF of Ctnnb1 cKO and control skin 1 wk after waxing. BMP signaling through nuclear pSMAD1/5/9 is indicated by yellow arrows. (E) Representative phenotype of TyrCreER Bmpr1afloxed R26YFP mice tamoxifen-treated mice in second telogen. (F) Quantification of pigment content in hair bulbs measured by optical density. (****) P < 0.0001, Mann–Whitney test; control n = 80 HFs (n = 4 mice); Bmpr1a cKO n = 43 HFs, (n = 3 mice). (G) Quantification of McSCs numbers per anagen HF 1 wk after waxing. (*) P = 0.0184, Mann–Whitney test; control n = 76 HFs (n = 5 mice); Bmpr1a cKO n = 45 HFs (n = 4 mice). (H) Quantification of EdU+ McSCs per HF 1 wk after waxing. (ns) Not significant, Mann–Whitney test; control n = 61 HFs (n = 3 mice); Bmpr1a cKO n = 45 HFs (n = 4 mice). (I) Quantification of McSCs per HF after five rounds of depilation, quantified in anagen 1 wk after the fifth wax. Mann–Whitney test; control n = 30 HFs (n = 3 mice); Bmpr1a cKO n = 40 HFs (n = 4 mice). (J) IMF shows presence of DCT+ hair bulb McSC progeny, but loss of nuclear pSMAD1/5/9 in YFP+ cells. Scale bars, 25μm.

