Figure 5.
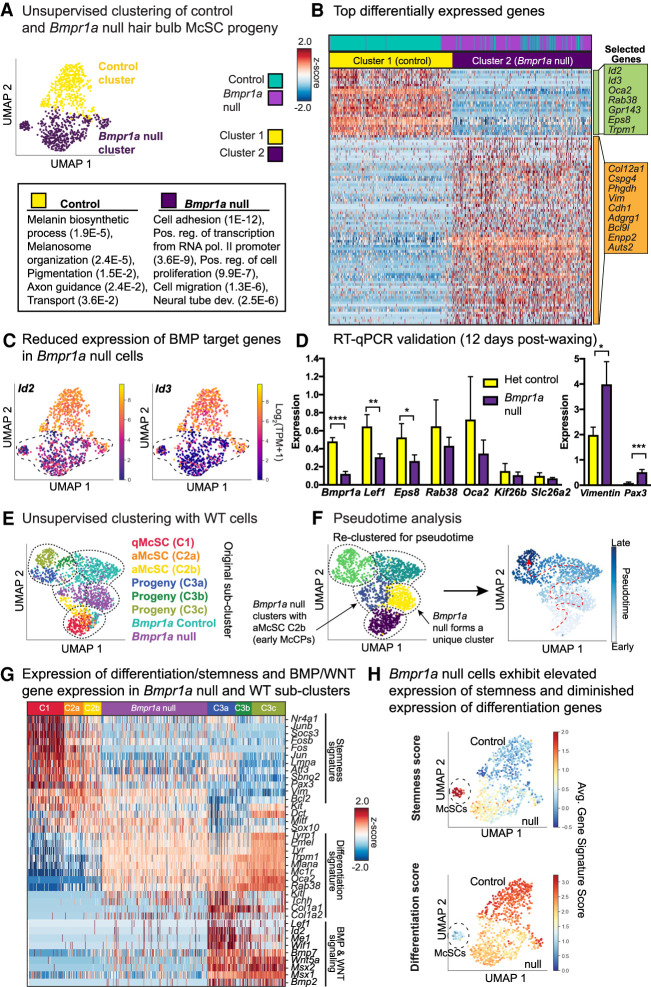
Pseudotime analysis of the Bmpr1a-null hair bulb McSC progeny suggests a block at the juncture between early activated melanocyte stem cell progeny and melanocyte maturation. (A) UMAP representation and unsupervised k-NN-based clustering of control and Bmpr1a-null cells colored by cluster identity. (B) Heat map of top differentially expressed genes for Bmpr1a-null versus stage-matched controls and selected GO terms (DAVID 6.8) to bottom left with (P-values). See also Supplemental Table S9. (C) Expression plots of Id2 and Id3 in YFP+ populations. (D) RT-qPCR expression of genes from single-cell RNA-seq list isolated 12 d postwaxing. (****) P < 0.0001 Bmpr1a, (**) P = 0.0035 Lef1, (*) P = 0.0269 Eps8, (*) P = 0.0148 Vimentin, (***) P = 0.0010 Pax3, unpaired t-test; heterozygous control n = 3 mice, Bmpr1a cKO n = 4 mice. (E) Unsupervised k-NN based clustering of original melanocyte lineage populations with Bmpr1a-null and control cells, colored by subcluster identity. (F) Pseudotime analysis of combined data sets colored by pseudotime clusters (left) and pseudotime order (right). Cells are colored by progression through pseudotime with dashed red arrow to indicate direction of progression. (G) Heat map showing expression of key signature genes in Bmpr1a-null cells relative to WT subclusters. (H) UMAP plots expressing stemness and differentiation scores for Bmpr1a-null and control cells.

