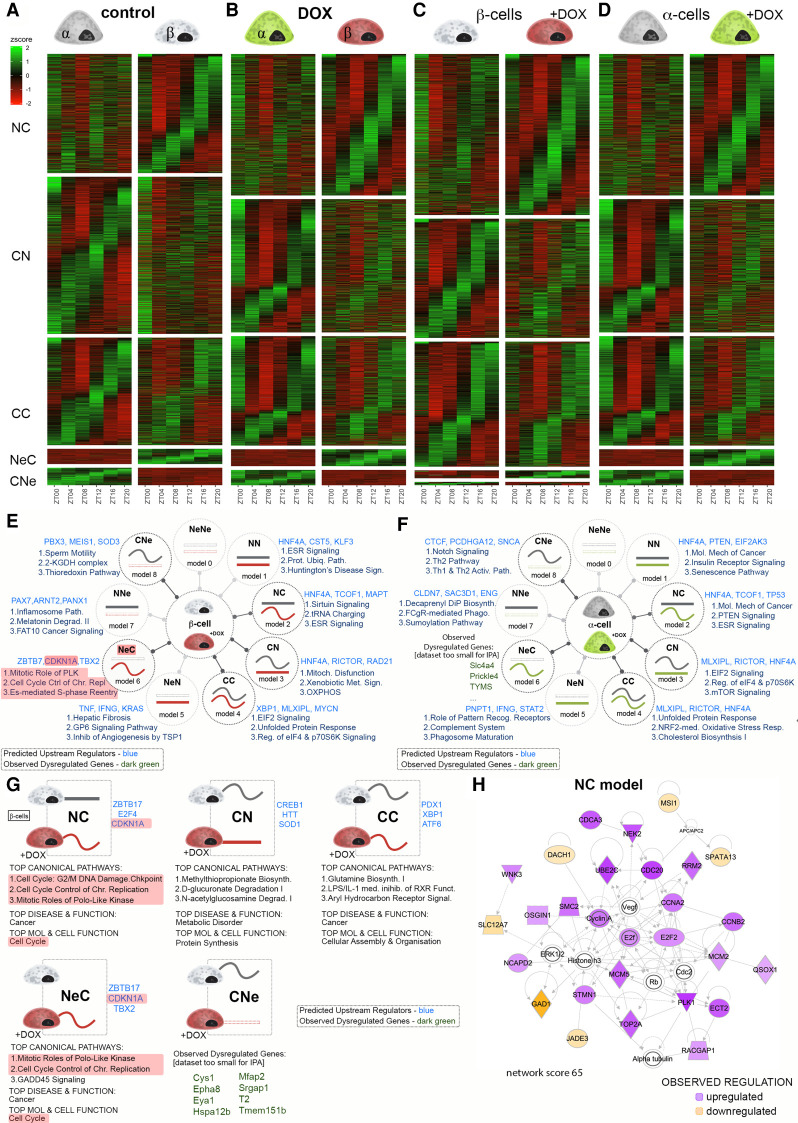
Figure 3.
Temporal analysis of gene expression in α and residual β cells following partial β-cell ablation. (A–D) Heat maps comparing temporal profiles of transcripts between α and β cells in control condition (A) or following β-cell ablation (DOX condition; B), between α cells in control and DOX groups (C), and between β cells (D) in control and DOX groups for the temporal transcript profile changes from nonrhythmic to circadian (NC), circadian to nonrhythmic (CN), circadian rhythmic in both conditions (CC), nonexpressed in one condition and circadian rhythmic in the other (NeC and CNe), nonexpressed in one condition and nonrhythmic in the other (NeN and NNe), and nonexpressed in both conditions (NeNe). (E,F) IPA of different models of rhythmic transcripts expressed in β cells (E) and in α cells (F), in control versus DOX-treated conditions. Three predicted upstream regulators (blue) and three most enriched functional pathways are listed next to the model drawings. For data sets too small to allow pathway analysis, a selection of genes belonging to the respective model is indicated (green). (G) IPA of sub-groups of rhythmic transcripts (Fig. 3C, models CC, NC, CN, NeC, and CNe) that were differentially expressed in β cells between control and DOX-treated conditions. Predicted upstream regulators (blue) are listed next to the schematic drawing of the temporal profile change. For data sets too small to allow pathway analysis, a selection of DEGs (green) is indicated. Top canonical pathways, disease, and molecular/cellular function are listed below the drawing. (H) Leading IPA-generated organic network of up-regulated and down-regulated transcripts that acquired rhythmicity following DOX treatment in the model NC in presented in G displaying the regulation of cell cycle related genes.

