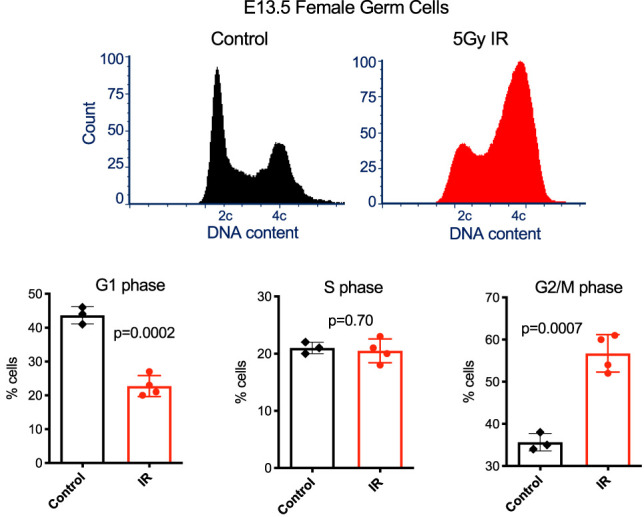
Figure 3.

Enrichment of G2/M-phase cells in IR exposed E13.5 female germ cells. Representative cell cycle profiles of control and treated E13.5 female germ cells are presented at the top, and percentages of cells in the indicated cell cycle stages are plotted at the bottom. Data are from three to four biological replicates, as indicated in the plots.
