Figure 5.

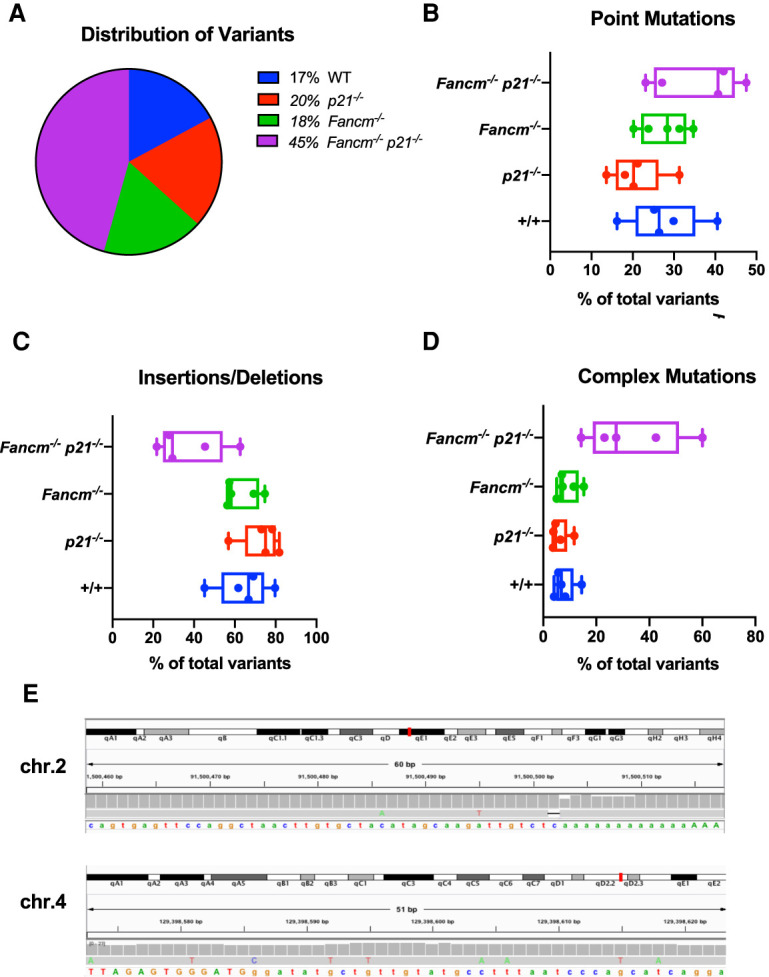
Variant detection in genetically rescued germ cells reveals an alteration mutational profile compared with controls. (A) Distribution of total variants with respect to genotype. (B) Point mutation frequency shown as a percentage of the total number of variants identified in each cell. (Kruskal-Wallis test, q = 0.09 between p21−/− and Fancm−/− p21−/−). (C) Insertion and deletion (InDel) mutation frequency shown as a percentage of the total number of variants identified in each cell. (Kruskal-Wallis test, q = 0.02 between p21−/− and Fancm−/− p21−/−) (D) Complex variant frequency shown as a percentage of the total number of variants identified in each cell. (Kruskal-Wallis test, q = 0.04 between wild type and Fancm−/− p21−/−). (E) Examples of two complex mutations from Fancm−/− p21−/− spermatids. Shown are IGV screen shots.
