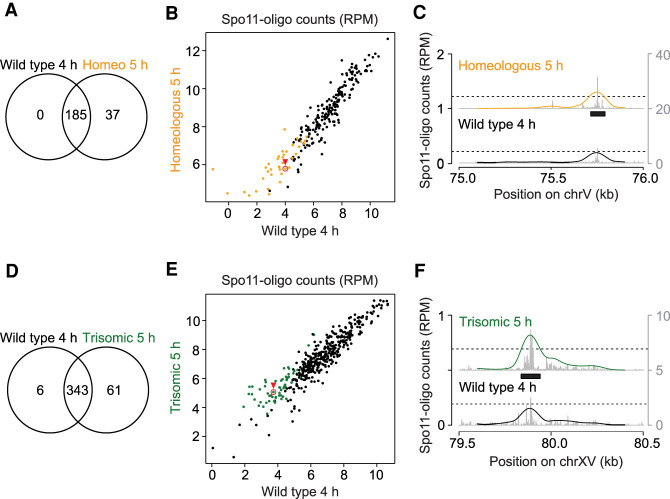
Figure 3.
Conserved hot spots on homolog engagement-defective chromosomes. (A,D) Venn diagrams showing the degree of overlap between hot spots called on chrV in wild-type and the homeologous strain (A) or on chrXV in wild-type and the trisomy XV strain (D). Hot spots were called using maps generated from time points where the total DSBs measured by Spo11-oligo labeling were maximal (4 h for wild-type and 5 h for homeologous and trisomic strains). (B,C,E,F) Comparison of hot spot strengths. Summed Spo11-oligo read counts (nRPM, normalized to RPM after copy number correction) are shown for all hot spots called on chrV (B) and chrXV (E). Orange dots are hot spots called only in the homeologous strain and green dots are those called only in the trisomic strain. The profiles for example hot spots highlighted with red circles and arrowheads are shown in C and F. (Black bars) Boundaries of the called hot spots, (line profiles) smoothed with a 201-bp Hann window, (left Y-axis) nRPM of smoothed profile, (right Y-axis) nRPM of raw data shown in gray.

