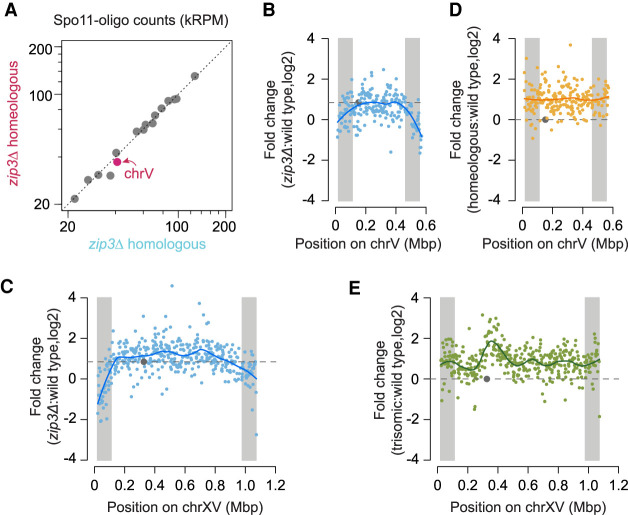
Figure 4.
No DSB overrepresentation on homeologous chromosomes in a zip3 mutant background. (A) Comparison of per-chromosome Spo11-oligo totals between zip3Δ homeologous and zip3Δ homologous maps. (B–E) Fold change of Spo11-oligo reads in hot spots along chrV (B,D) and chrXV (C,E) between different strains versus wild type as labeled. For the purpose of chromosome copy number correction, the reads on homeologous chrV were doubled and the reads on trisomic chrXV were multiplied by 2/3. For the zip3Δ map a scaling factor of 1.8-fold was applied to account for the global increase in the number of Spo11-oligo complexes in this strain (Thacker et al. 2014). Lines, local regression (loess); dashed horizontal lines, no change for D or E, and genome average change for B and C. (Gray circles) Centromeres, (gray shading) EARs (defined as the regions from 20 to 110 kb from telomeres).

