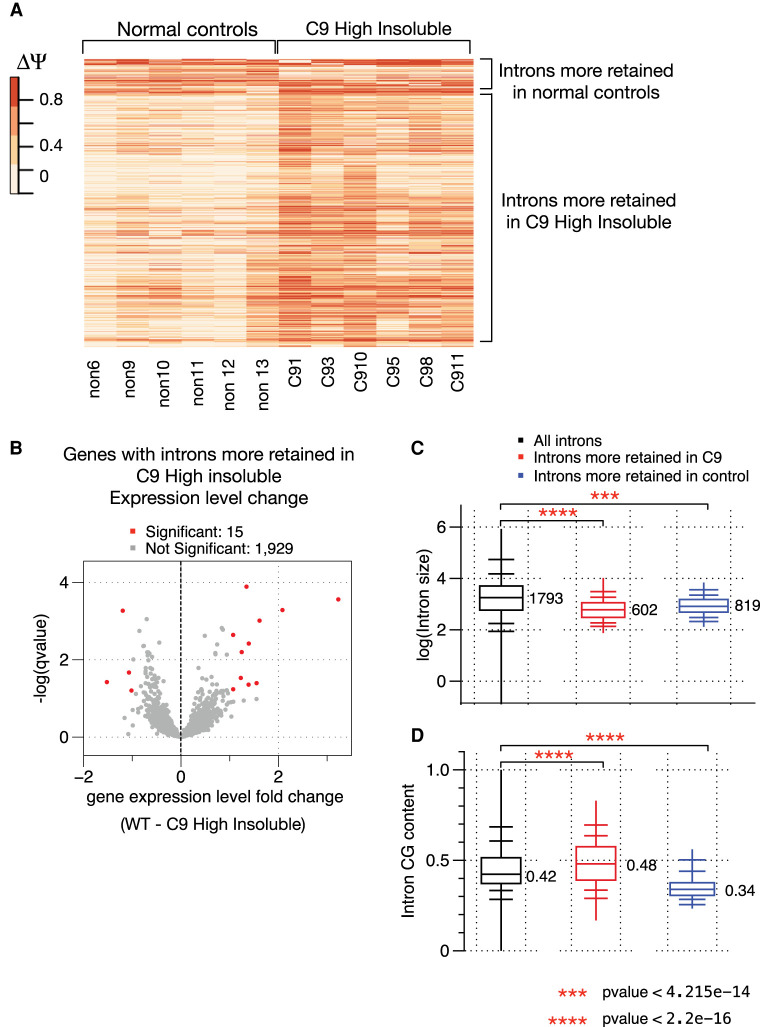
Figure 2.
Prevalent, elevated intron retention in C9high patient samples does not change overall gene expression levels of the affected transcripts. (A) Heat map of the changed intron retention levels for 3177 introns (column), comparison across six normal control samples and six C9high patient samples. Magnitude and direction of changes in intron retention between normal controls and C9 samples are color-coded. (B) Volcano plot showing the overall expression level changes in genes that undergo significantly elevated intron retention. X-axis shows fold changes in gene expression level between normal controls and C9high patient samples. (C) Box plot showing intron length distribution between introns that are more retained in C9high patient samples, introns that are more retained in normal controls, and all introns detected in the brain samples. (D) Box plot showing intron CG content comparison between introns that are more retained in C9high patient samples, introns that are more retained in normal controls, and all introns detected in the brain samples.

