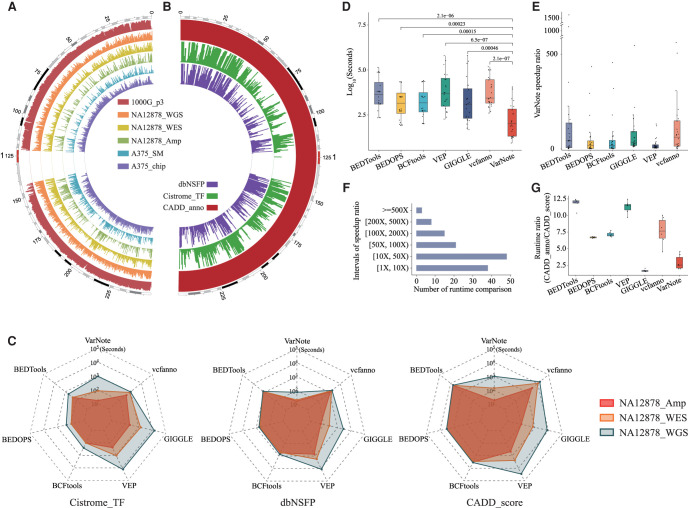
Figure 2.
Comparison of VarNote with existing tools for interval-level annotations. (A) The genomic distribution of six query variant data sets across Chromosome 1 of the human reference genome, including variant call result of The 1000 Genomes Project phase3 (1000G_p3), variant call result of 10x Genomics Chromium whole-genome sequencing for NA12878 (NA12878_WGS), variant call result of Nextera Rapid Capture Exome and Expanded Exome whole-exome sequencing for NA12878 (NA12878_WES), variant call result of Ion AmpliSeq Exome capture sequencing data for NA12878 (NA12878_Amp), genotype calling result of Affymetrix Genome-Wide Human SNP Array 6.0 data for A375 cell line (A375_chip), and somatic mutation call result of whole-exome sequencing data for A375 cell line (A375_SM). These data sets span the highly unbalanced and sparse queries to the highly balanced and dense queries. (B) The genomic distribution of three annotation databases across Chromosome 1 of the human reference genome, including functional prediction and annotation of all potential nonsynonymous SNVs (dbNSFP), Cistrome aggregated ChIP-seq peak calling result of human transcription factors (Cistrome_TF), CADD deleteriousness score, and related annotation of all possible SNVs (CADD_anno). (C) The runtime comparisons among VarNote, BEDTools, BEDOPS, BCFtools, VEP, vcfanno, and GIGGLE for sequencing variants at different scales and commonly used annotation databases. (D) The runtime distribution of 24 combinatory tests for each algorithm. (E) The speed ratio of VarNote compared with other methods for each of 24 tests. (F) The number of runtime comparisons between VarNote and other methods within corresponding speed ratio intervals. (G) The runtime ratio distribution for processing long annotation database CADD_anno over short annotation database CADD_score.

