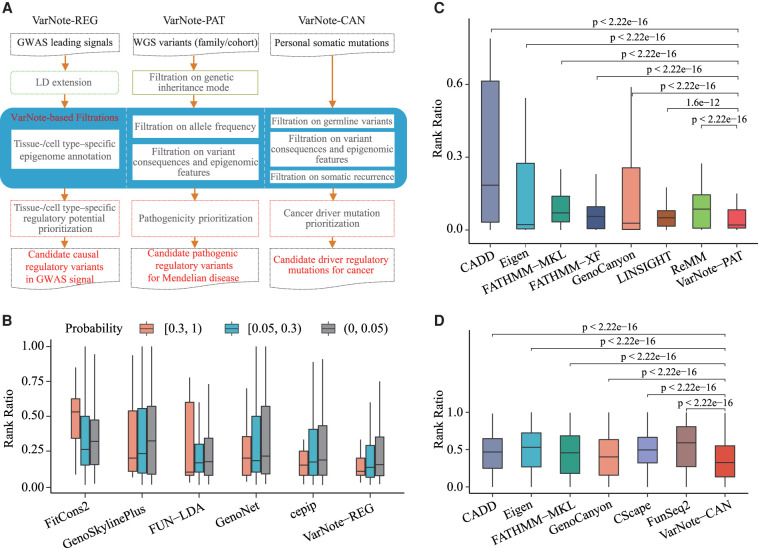
Figure 5.
The applied pipelines and performance evaluations of VarNote for disease-causal variant prioritization. (A) The function summary of three designed pipelines based on VarNote framework. (B) The box plot of rank ratio for each PICS causal variant among different PICS probability intervals; the rank ratio is measured by the rank of observed variant/total number of investigated variants (including extended highly linked variant in LD) in each GWAS signal. (C) The box plot of rank ratio for each spike-in pathogenic variant using simulated WGS variants; the rank ratio is measured by the rank of pathogenic variant/total number of qualified variants after filtrations in each simulated individual genome, tested by one-tailed Mann–Whitney U test. (D) The box plot of rank ratio for each spike-in somatic eQTL mutation using simulated cancer genome profiles; the rank ratio is measured by the rank of somatic eQTL mutation/total number of qualified mutations after filtrations in each simulated cancer genome, tested by one-tailed Mann–Whitney U test.

