. 2020 Nov 11;2(6):e190220. doi: 10.1148/ryai.2020190220

Figure 5:

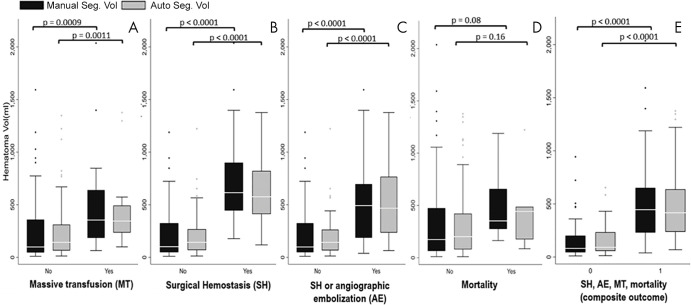
Clustered box and whisker plots show medians, interquartile ranges, and 95% CIs for, A, the need for massive transfusion, B, the need for surgical hemostasis, C, the need for surgical hemostasis or angioembolization, D, in-hospital mortality, and, E, a derived composite outcome including all end points (right side).

Clustered box and whisker plots show medians, interquartile ranges, and 95% CIs for, A, the need for massive transfusion, B, the need for surgical hemostasis, C, the need for surgical hemostasis or angioembolization, D, in-hospital mortality, and, E, a derived composite outcome including all end points (right side).