. 2020 Sep 15;297(3):675–684. doi: 10.1148/radiol.2020200302

Figure 6l:

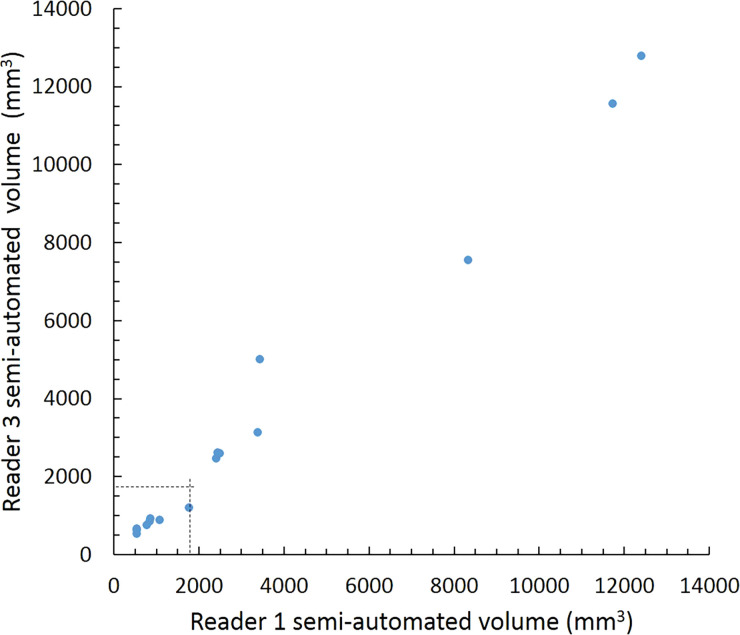
Scatterplots show lung nodule measurements for each reader pair and measurement method. (a–c) Manual diameter measurements; (d–f) semiautomated diameter measurements; (g–i) semiautomated volume measurements for measured volumes less than 500 mm3; and (j–l) semiautomated volume measurements for measured volumes greater than or equal to 500 mm3. Dashed lines indicate upper thresholds for Lung CT Screening Reporting and Data System (Lung-RADS) category 2 (<6 mm or <113 mm3), Lung-RADS category 3 (<8 mm or <268 mm3), and Lung-RADS category 4A (<15 mm or <1767 mm3). Some points in a–f may represent more than one identical measurement pair. Numbers in parentheses are 95% confidence intervals. P values were less than .001 for all intraclass correlation coefficient (ICC) values.

Scatterplots show lung nodule measurements for each reader pair and measurement method. (a–c) Manual diameter measurements; (d–f) semiautomated diameter measurements; (g–i) semiautomated volume measurements for measured volumes less than 500 mm3; and (j–l) semiautomated volume measurements for measured volumes greater than or equal to 500 mm3. Dashed lines indicate upper thresholds for Lung CT Screening Reporting and Data System (Lung-RADS) category 2 (<6 mm or <113 mm3), Lung-RADS category 3 (<8 mm or <268 mm3), and Lung-RADS category 4A (<15 mm or <1767 mm3). Some points in a–f may represent more than one identical measurement pair. Numbers in parentheses are 95% confidence intervals. P values were less than .001 for all intraclass correlation coefficient (ICC) values.