
Figure 2.
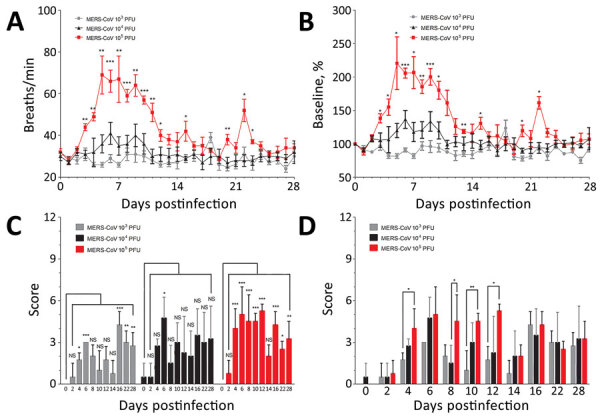
Clinical disease signs in African green monkeys after infection with small particle aerosol MERS-CoV. A, B) Respiratory rates were observed twice daily for all groups and recorded. Statistically significant differences on the graph reflects analysis comparing respiratory rates between the 103 and 105 PFU dose groups. C, D) Clinical scores incorporated signs of MERS-CoV infection, based in part on observations of responsiveness, respiratory function (other than respiratory rate), lymphadenopathy, and dehydration. Differences between respiratory rate and clinical score groups were determined by using 1-way analysis of variance (Tukey’s multiple comparison test; *p<0.05, **p<0.01, ***p<0.001). MERS-CoV, Middle East respiratory syndrome coronavirus.