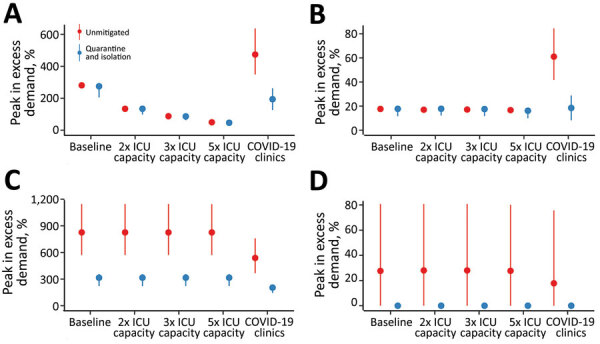
Figure 4.

Estimated peak excess demand for healthcare sector services, by percentage, during the COVID-19 epidemic, Australia. The graphs compare exceedance for COVID-19 admissions for A) ICU beds; B) hospital ward beds; C) emergency departments; and D) general practitioner services at baseline, 2×, 3×, and 5× ICU capacity. The COVID-19 clinics scenario reflects an alternative triage pathway and baseline capacity. Red denotes unmitigated scenarios with no public health interventions in place; blue denotes the mitigated scenarios with quarantine and isolation in place. Dots denote the median; lines range from 5th–95th percentiles of simulations. COVID-19, coronavirus disease; ICU, intensive care unit.
