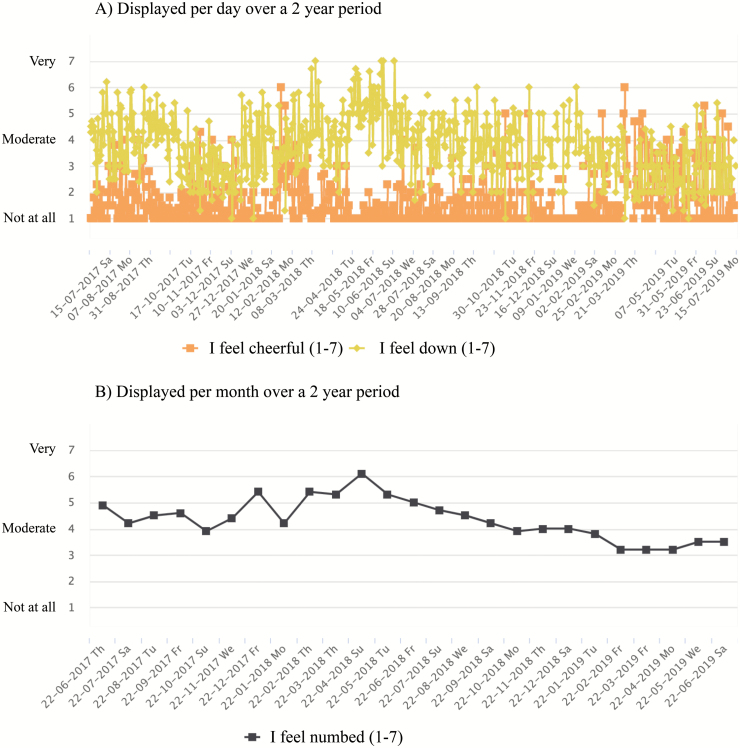
Fig. 2.
Online feedback graph showing my experience sampling data over a period of 2 years. Part (A) displays the mood items cheerful and down over time with answers averaged by day. Fluctuations in my mood can be seen, next to how the feelings relate to each other. Part (B) displays the item numbed over time with answers averaged by month. A general decline can be seen in how numb I felt, showing my overall recovery.

