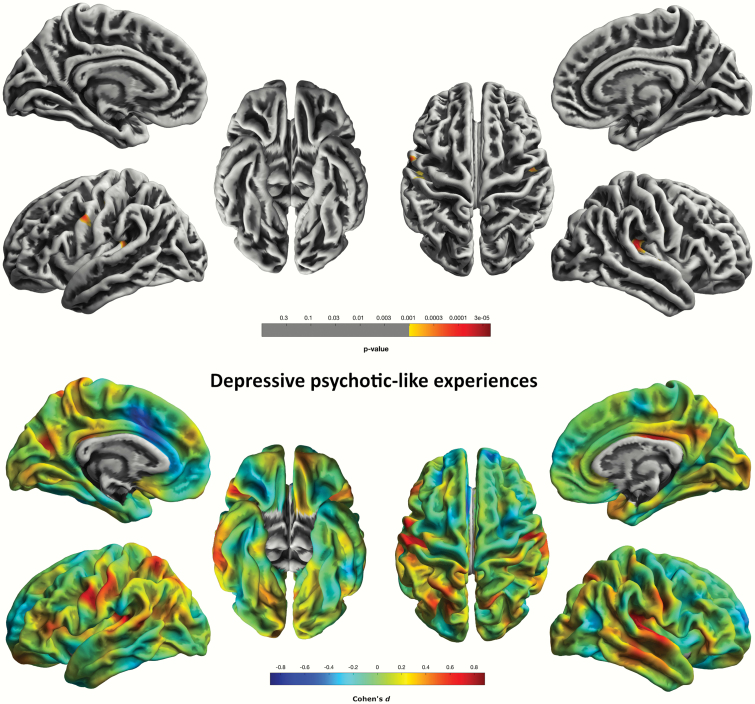
Fig. 2.
Logarithmic P-value maps of significant negative correlations of cortical gyrification and CAPE-dep scale in 103 healthy individuals (P < 0.001, uncorrected, for display purposes) (top). Cohen’s d maps of effect sizes for uncorrected correlations of gyrification with the CAPE-dep scale in 103 healthy individuals (bottom).

