
FIGURE 3.
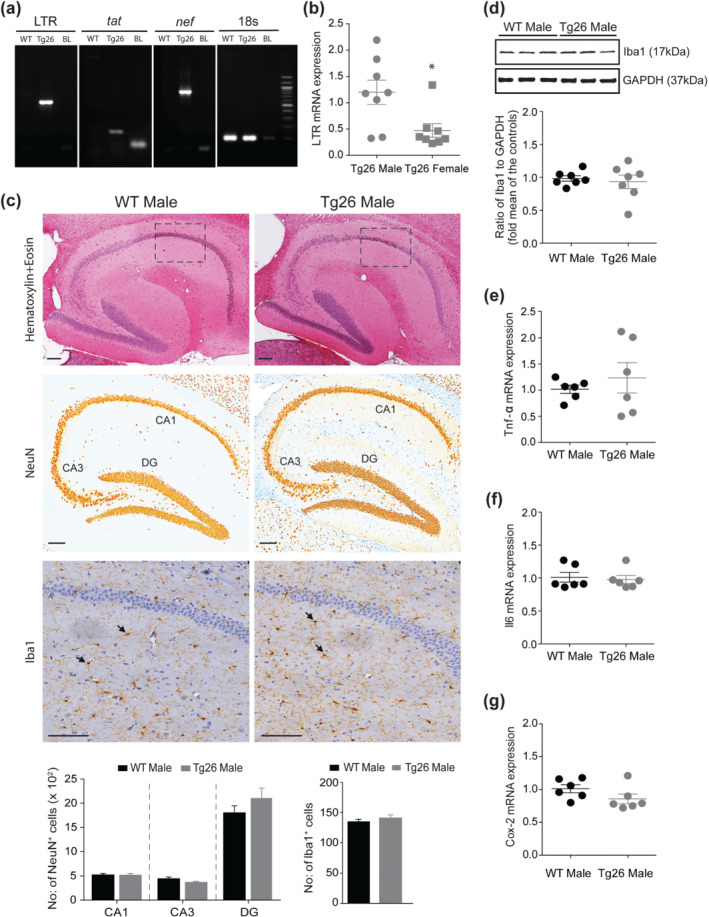
Male Tg26 mice show increased hippocampal expression of HIV‐1 long terminal repeat (LTR) mRNA, which did not result in neuronal loss and microglial activation. (a) PCR reactions on total genomic DNA isolated from hippocampal brain regions show specific bands for HIV‐1 LTR, tat and nef in Tg26, but not in WT, mouse. Equal sized bands were detected for 18s, which served as housekeeping control. (b) qRT‐PCR analysis of hippocampal HIV‐1 LTR gene in male and female Tg26 mice (n = 8 per group). *P < 0.05, unpaired Student's t‐test. (c) Immunohistochemistry of paraffin‐embedded sagittal sections of hippocampal brain region of male WT and Tg26 mice. Representative images of haematoxylin and eosin staining (top panel) shows no overt signs of pathology. Representative images of anti‐neuronal nuclei (NeuN) and anti‐ionized calcium binding adaptor molecule 1 (Iba1) immunostaining (middle and bottom panels, respectively) and analyses (histograms) show similar numbers of NeuN positive neurons (in areas CA1, CA3 and dentate gyrus (DG)) and Iba1 positive microglial cells between male WT and Tg26 mice. Insets in the top panel indicate area of selection for representative Iba1 images. Black arrow heads (bottom panels) indicate Iba1 positive microglial cells. Scale bar 50 μm, n = 6 for WT mice (average of four brain sections per mouse) and n = 5 for Tg26 mice (average of six brain sections per mouse). (d) Representative western blots and densitometric analysis of Iba1 protein (17 kDa) showing similar hippocampal levels between male WT and Tg26 mice (n = 7 per group). GAPDH (37 kDa) served as loading control. (e–g) qRT‐PCR analysis of hippocampal Tnf‐α, Il6 and Cox‐2 mRNA showing similar gene expression between male WT and Tg26 mice (n = 6 per group)