
FIGURE 4.
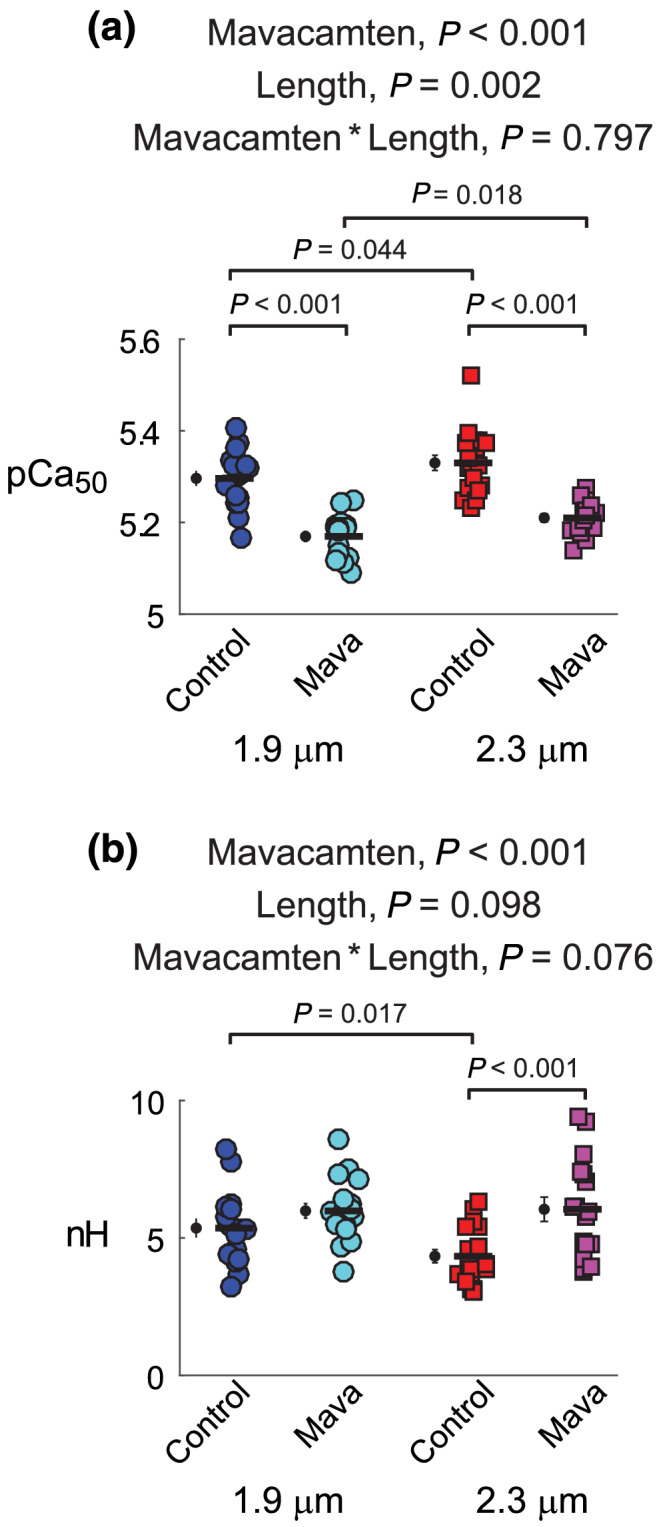
Effects of mavacamten on calcium activation of contraction at 1.9 and 2.3 μm sarcomere length. (A) pCa50 values and (B) n H values from fits to Equation 1 are shown for each myocardial strip from each experimental group. Significant main effects and the associated interaction from linear mixed models analysis are listed above each panel for respective data therein. Jitter plots (coloured symbols) show measurements for each myocardial strip, with n listed in the legend of Figure 2. Black symbols show mean ± SEM for each group plotted to the left of individual measurements