
FIGURE 6.
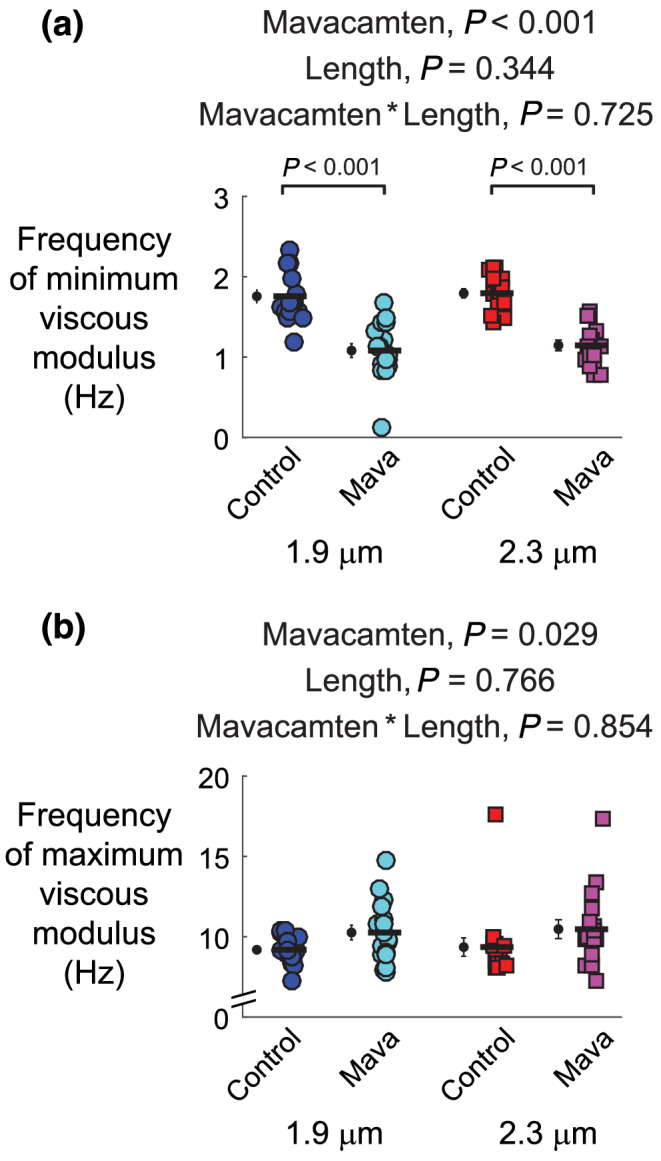
Effects of mavacamten on frequency‐dependent shifts in the minimum and maximum viscous modulus at 1.9‐ and 2.3‐μm sarcomere length. The (a) frequency producing the minimum viscous modulus and (b) frequency producing the minimum viscous modulus from polynomial fits to these associated regions of interest. Frequency shifts in the minimum and maximum viscous modulus describe relative changes in cross‐bridge recruitment and detachment rates, respectively. Significant main effects and the associated interaction from linear mixed models analysis are listed above each panel for respective data therein. Jitter plots (coloured symbols) show measurements for each myocardial strip, with n listed in the legend of Figure 2. Black symbols show mean ± SEM for each group plotted to the left of individual measurements