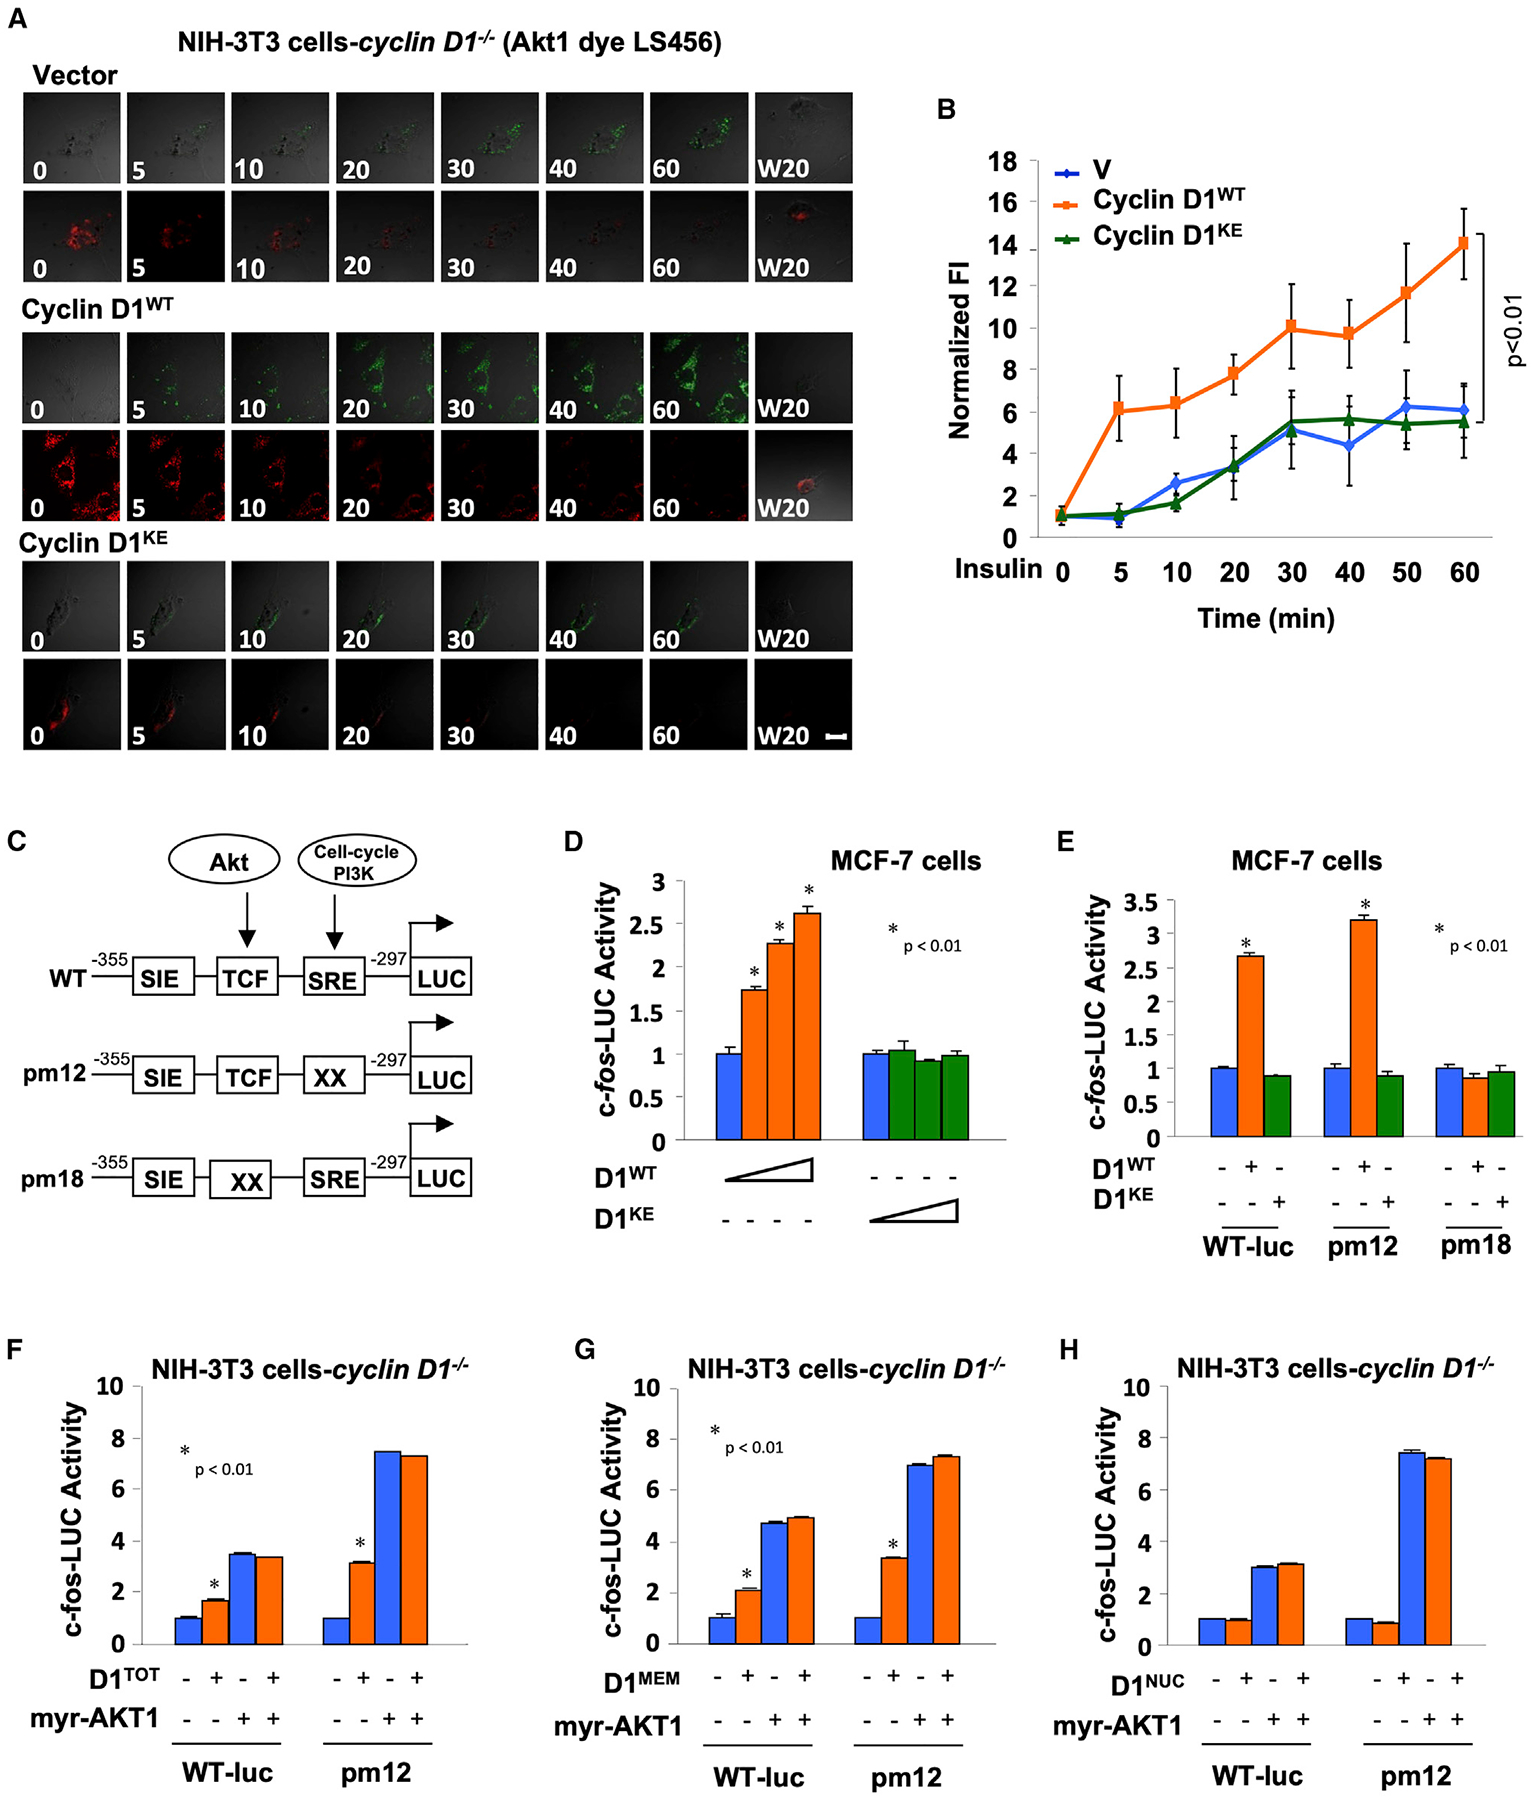
Figure 6. Induction of Immediate Early Gene Akt Signaling via Membrane-Associated Cyclin D1.

(A) The fluorescent intensity (FI) of LS456 in cyclin D1−/− 3T3 cells transduced with either vector, cyclin D1WT, or cyclin D1KE. The FI of LS456 decreased in the 800-nm channel and increased in the 700-nm channel in response to insulin, indicated as fluorescent images in cells.
(B) Quantitative analysis of the FI in cyclin D1WT versus cyclin D1KE or vector control. Fluorescent images in cells are superimposed on differential interference contrast images. Scale bars, 10 μm. Data are presented as mean ± SEM for n = 8 separate cells.
(C) Schematic representation of c-fos promoter luciferase reporter genes including point mutations of the SRE and TCF site.
(D and E) c-fos-LUC promoter activity in MCF-7 cells (D) transfected with expression vectors encoding either cyclin D1WT or cyclin D1KE or (E) transfected with c-fos-LUC reporter mutants.
(F–H) Cyclin D1−/− 3T3 cells were co-transfected with expression vector encoding c-fos-LUC WT or mutant and activated Akt (myr-Akt1) or (F) cyclin D1, (G) membrane-localized cyclin D1, or (H) nuclear-localized cyclin D1.
