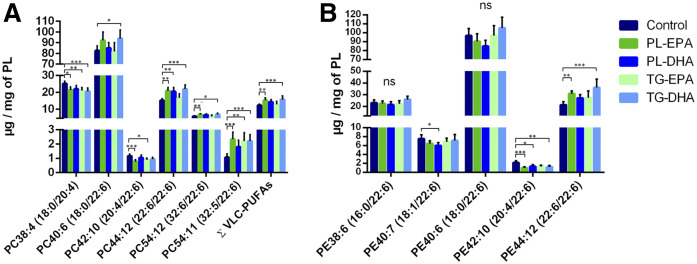
Fig. 3.
In retina, PL-EPA and TG-DHA groups showed an increase in most DHA-containing PC and PE and VLC-PUFAs. Quantitative amounts of relevant species contained within PC (A) and PE (B) in the retina. Bars represent the mean + SD. P values were determined by Kruskal Wallis test, compared with the control group. *P < 0.05, **P < 0.01, ***P < 0.001.

