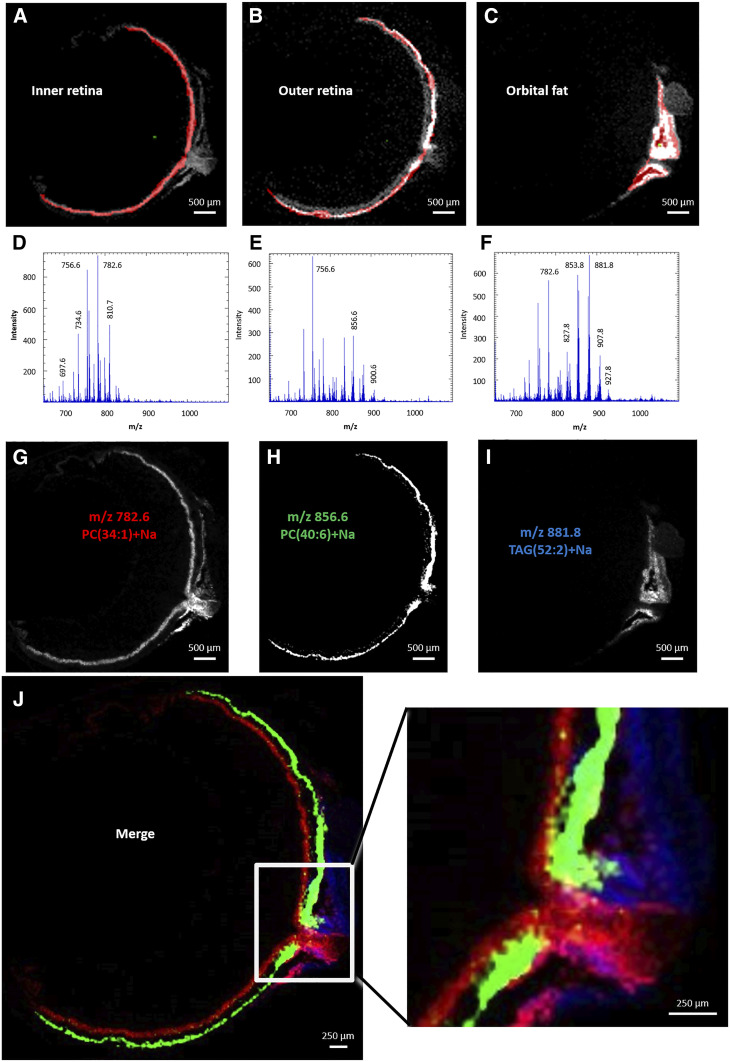
Fig. 6.
Positive ion MALDI-IMS in rat ocular tissue. Regions of interest were selected as inner retina (A), outer retina (B), and orbital fat (C), corresponding to total positive ion MALDI mass spectra of inner retina (D), outer retina (E), and orbital fat (F). Extracted positive ion MALDI images of the [M+Na]+ ions of PC34:1 (m/z 782.6 amu) (G), PC40:6 (m/z 856.6 amu) (H), and TG52:2 (m/z 881.8 amu) (I). J: Merged positive ion MALDI images of PC34:1 (red), PC40:6 (green), and TG52:2 (blue).

