Fig. 3.
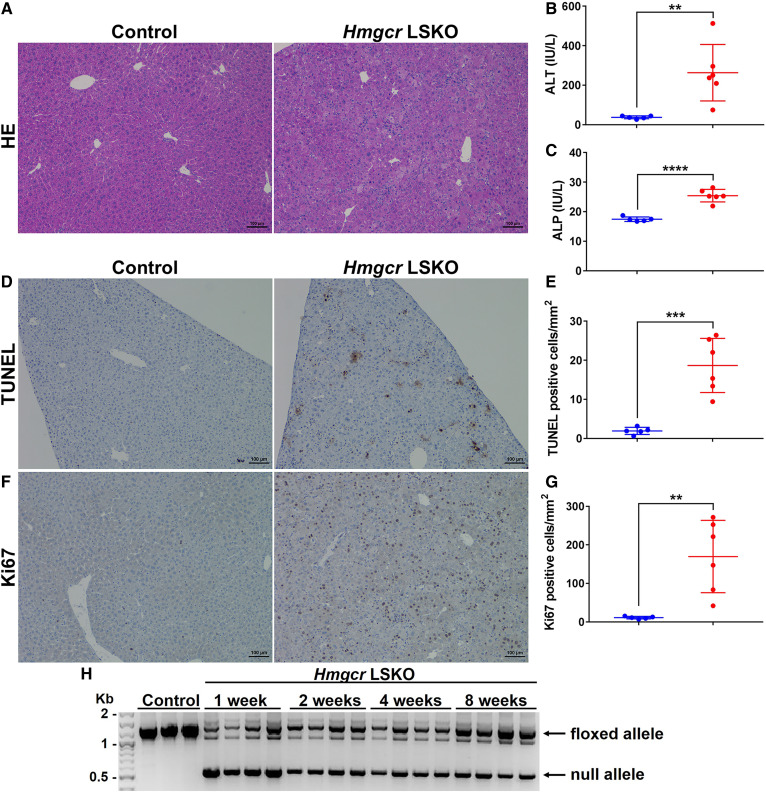
Hmgcr LSKO mice show increased hepatocyte apoptosis and liver regeneration. A: Hematoxylin and eosin (HE) staining of control and Hmgcr KO liver sections. ALT (B) and ALP (C) measurement in plasma from control (blue) and Hmgcr LSKO (red) mice. TUNEL staining of liver sections (D) and quantification of TUNEL-positive hepatocytes per square millimeter in control (blue) and Hmgcr KO (red) livers (E). Ki67 staining of liver sections (F) and quantification of Ki67-positive hepatocytes per square millimeter in control (blue) and Hmgcr KO (red) livers (G). H: Hmgcr genotyping PCR on liver DNA from Hmgcr LSKO mice at 1, 2, 4, and 8 weeks post-AAV-Cre injection. The two main bands correspond to the Hmgcr floxed (1,364 bp) and null (544 bp) alleles. Representative IHC images are shown (scale bar is 100 μm). Data are presented as mean ± SD, with significance determined by two-tailed Student’s t-test (n = 5 control and 6 Hmgcr LSKO mice). **P < 0.01, ***P < 0.001, and ****P < 0.0001.

