Fig. 1.
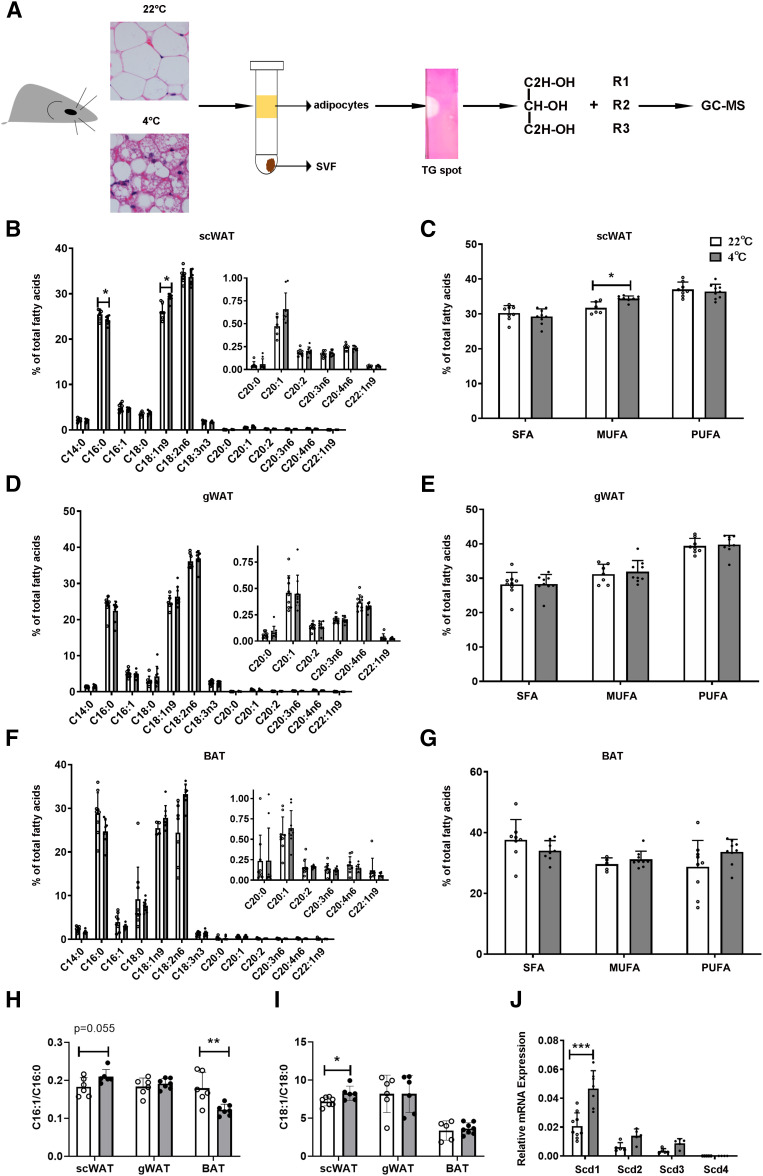
The changes of FAs in the TAG of WAT and BAT adipocytes in response to cold exposure. A: Schematic model describes the method of TAG FA in adipocyte analysis. Adipocytes were enzymatically dissociated from scWAT, gWAT, and BAT of C57BL/6J mice either at RT (22°C) or during cold exposure (4°C) for 3 days. TAGs were separated and collected by TLC. After being hydrolyzed by KOH, lipids were esterified to form methyl esters. Methyl esters were detected by GC-MS. Lipid species were quantified based on comprehensive peak area. B, C: FAs were obtained from scWAT of mice housed at RT (22°C) or during cold exposure (4°C) for 3 days. (n = 8 for each group) according the methods in A. FA profiles were analyzed (B) and percentage of SFAs, MUFAs, and PUFAs were calculated (C). D, E: The same analysis as in B and C from gWAT samples of the same mice. F, G: The same analysis as in B and C from BAT samples of the same mice. H, I: SCD desaturation indices were calculated accordingly: SCD-16 = 16:1/16:0 and SCD-18 = 18:1/18:0, as shown in H and I, respectively. J: Relative mRNA expression of Scd1–Scd4 in scWAT from mice housed at RT or during cold exposure for 3 days. (n = 7–9 for each group). Statistical analysis: unpaired Student’s t-test in B–J. Data were expressed as mean ± SD. *P < 0.05, **P < 0.01, ***P < 0.001.

