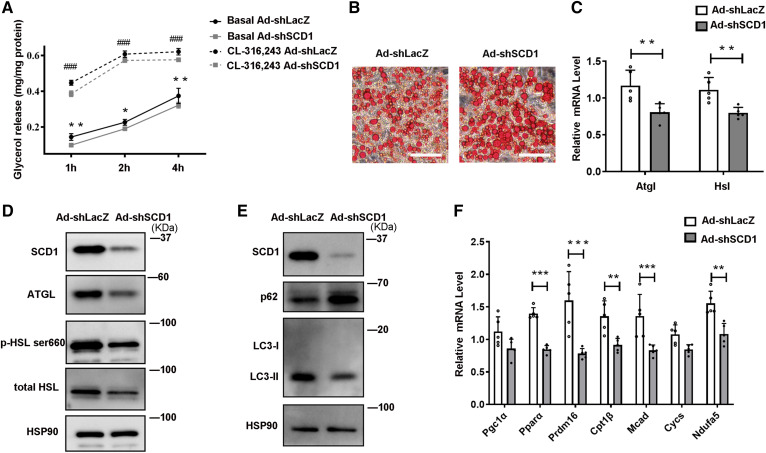
Fig. 4.
Knockdown SCD1 inhibits lipolysis in cultured adipocytes by downregulating lipases and lipophagy. C3H10T1/2 mesenchymal stem cells were differentiated for 6 days during the adipogenic program. A: Relative glycerol release from C3H10T1/2 adipocytes treated with Ad-shLacZ or Ad-shSCD1 for 3 days before the lipolysis experiment. Adipocytes were cultured without or with 0.1 μM CL-316,243 (cell culture medium was changed to phenol red-free medium containing 2% BSA without FAs). The glycerol content of the culture medium was quantified with a glycerol release kit (Applygen, E1002) at 1, 2, and 4 h (n = 4 for each group). Total cellular protein was quantified for the glycerol normalization. Experiments were independently repeated three times. B: Oil Red O staining of C3H10T1/2 cells treated with Ad-shLacZ or Ad-shSCD1. C: Relative mRNA expression of Atgl and Hsl in cells treated with Ad-shLacZ or Ad-shSCD1 for 3 days (n = 5 in each group). D: Representative Western blot of the lipase proteins ATGL, HSL, and p-HSLser660 in cells treated with Ad-shLacZ or Ad-shSCD1 for 3 days. E: Representative Western blot of the lipophagy marker proteins (p62 and LC3-II) in cells treated with Ad-shLacZ or Ad-shSCD1 for 3 days. F: Relative mRNA expression of the transcriptional regulators and FA oxidation enzymes, nuclear-encoded mitochondrial genes in cells treated with Ad-shLacZ or Ad-shSCD1 for 3 days (n = 5 in each group). Statistical analysis: two-way ANOVA in A, unpaired Student’s t-test in C and F. Data were expressed as mean ± SD. *P indicated for the comparisons at the basal condition (Ad-shLacZ vs. Ad-shSCD1); #P indicated for the comparisons at the CL-316,243 stimulated condition (Ad-shLacZ vs. Ad-shSCD1). Data were expressed as mean ± SD. *P < 0.05, **P < 0.01, ***P < 0.001. #P < 0.05, ##P < 0.01, ###P < 0.001.

