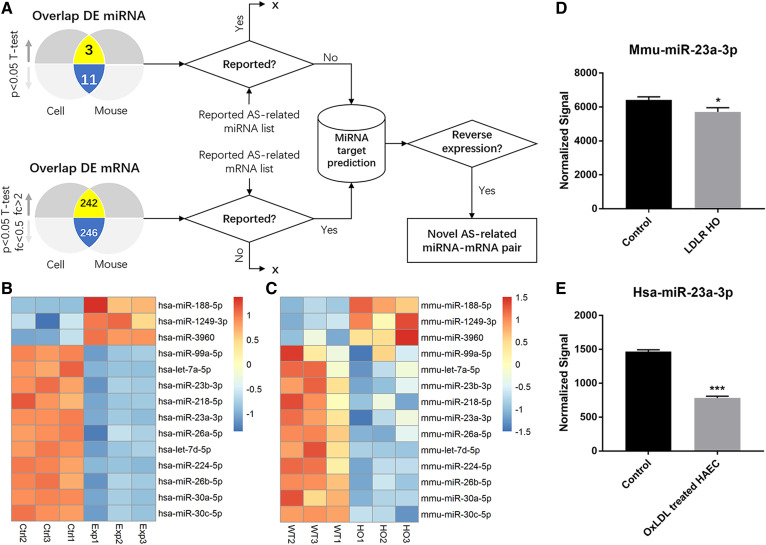
Fig. 3.
Atherosclerosis-related miRNA screening and profiling. A: Screening flow of novel atherosclerosis (AS)-related miRNAs. B: Heat map of up- and downregulated miRNAs in the in vitro model. C: Heat map of up- and downregulated miRNAs in the in vivo model. D: Microarray analysis of miR-23a-3p in the in vivo model. E: Microarray analysis of miR-23a-3p in the in vitro model. Error bars represent standard deviations. *P < 0.05, ***P < 0.001, compared with control or WT by the Student’s t-test.

