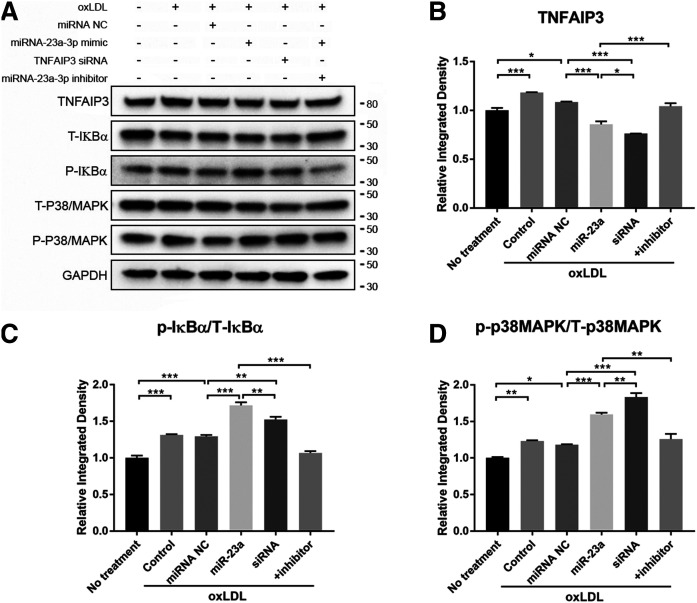
Fig. 6.
miR-23a-3p regulation occurs through the NF-κB and p38/MAPK pathways. A: Western blot analysis of p38/MAPK and IκBα phosphorylation after treatment with miR-23a-3p, miR-23a-3p inhibitor, and TNFAIP3 siRNA under oxLDL induction. Cells were transfected with miRNAs for 24 h followed by oxLDL treatment for 48 h. The + inhibitor indicates co-application of miR-23a-3p and its inhibitor. B: Quantification of TNFAIP3 expression levels. C: Quantification of IκBα phosphorylation. D: Quantification of p38/MAPK phosphorylation. All quantifications were evaluated with ImageJ. p/T, phosphorylation to total protein ratio Error bars represent standard deviations. *P < 0.05, **P < 0.01. Multiple comparisons were performed by one-way ANOVA followed by post hoc Tukey’s test.

