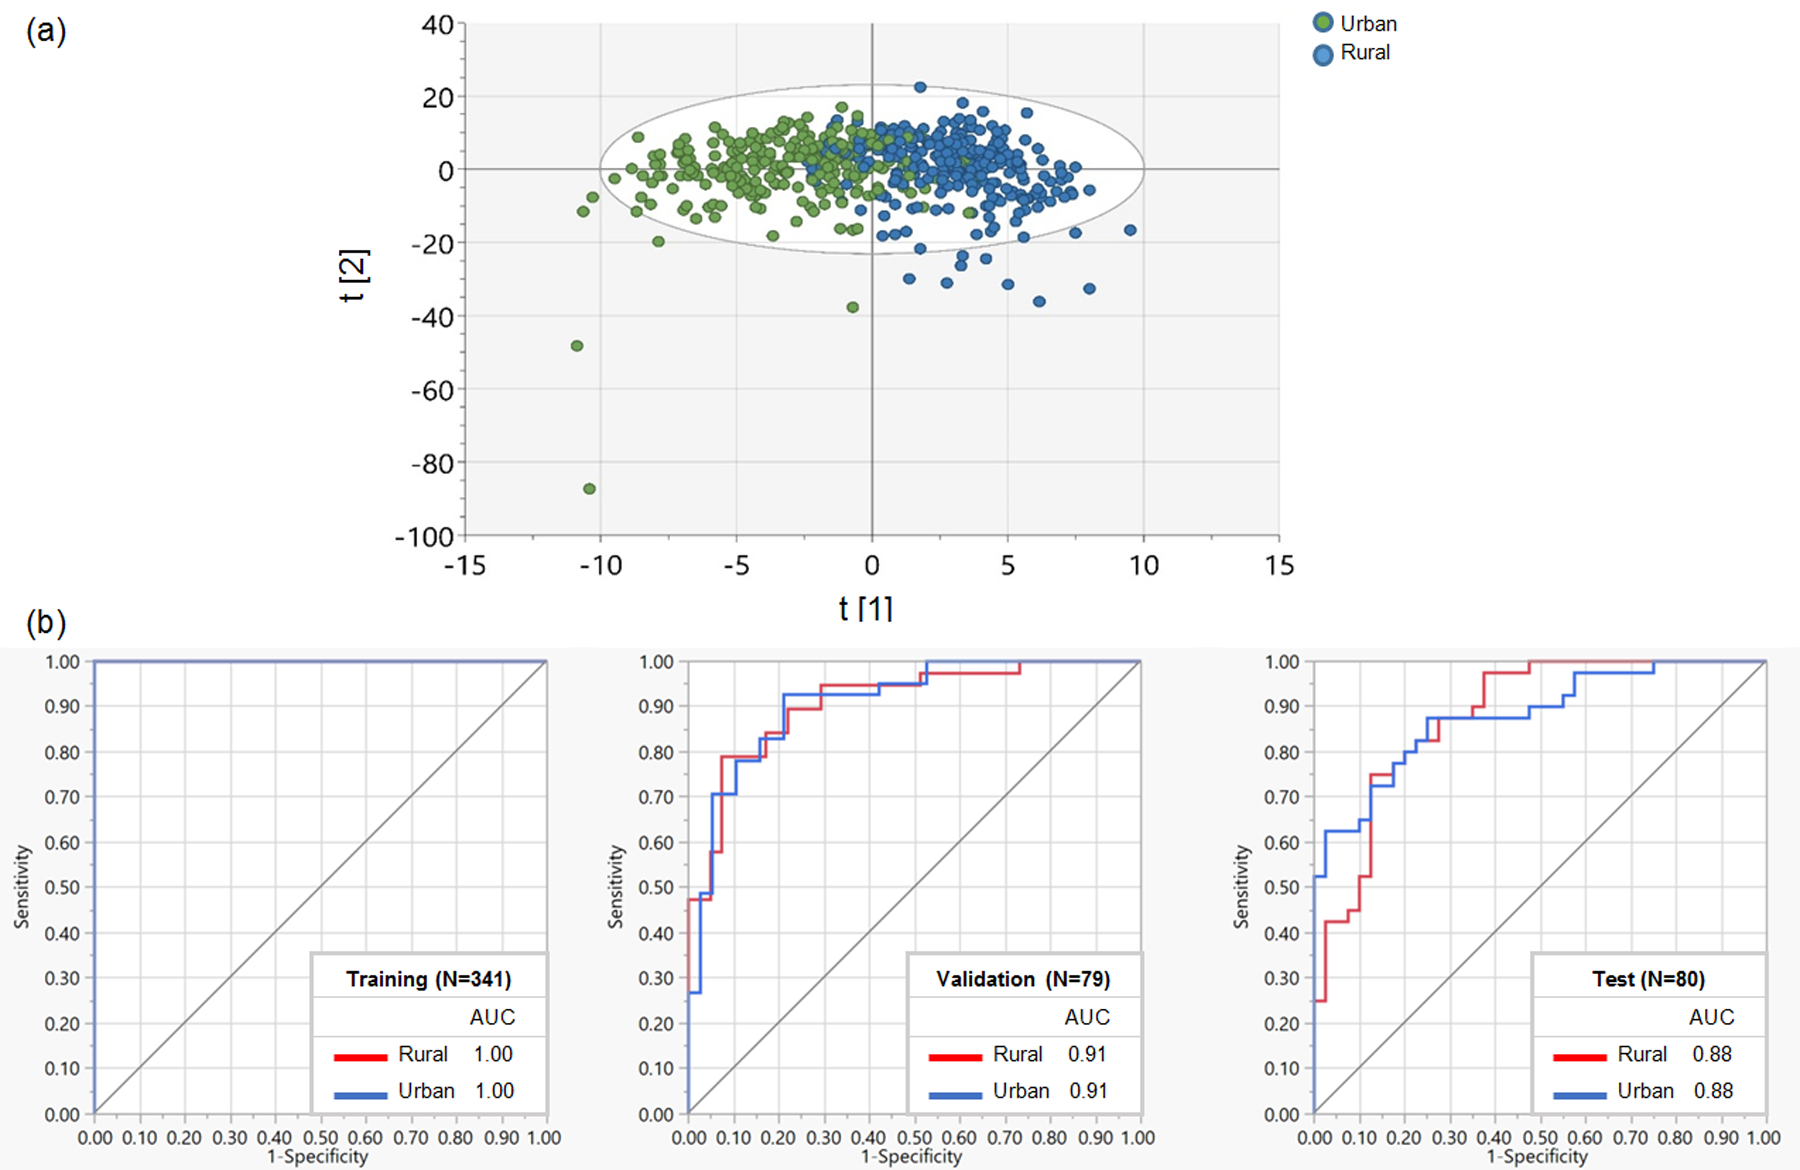
Fig 1.

(a) Orthogonal Partial Least Squares Discriminant Analysis (OPLS-DA) score plot for the separation of plasma metabolome by urban and rural status. T [1] and t [2] are the first two latent variables (i.e., linear combinations of metabolite data) in the OPLS-DA model using all identified metabolite features, where t [1] is the class-predictive latent variable that captures the variation in metabolites between urban and rural areas and t [2] is the class-orthogonal latent variable that includes systematic variation in metabolite data uncorrelated with urbanization status. Together, t [1] and t [2] provide the best separation of the urban and rural samples in OPLS-DA. (b) Receiver operating characteristic (ROC) curve for the discrimination of urban and rural metabolome using random forest classification.
AUC, area under the curve.
