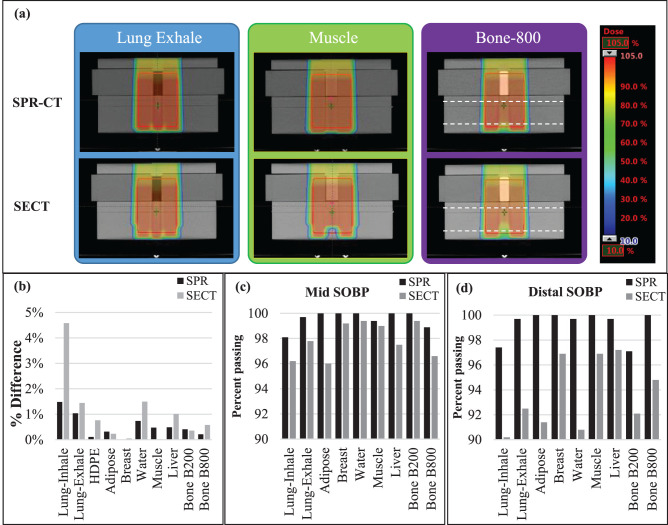
Figure 5.
(a) Treatment plans created on the stopping-power-ratio (SPR) and single-energy computed tomography (SECT) images of the phantom with lung exhale, muscle, and bone B800 plugs in the high-density polyethylene (HDPE) phantom. (b) The percentage of difference ([Dmeasured − Dcalculated]/Dmeasured) of the ion chamber–measured dose and the treatment planning system–calculated (on SPR and SECT images) dose for HDPE and 9 tissue-surrogate plugs of the CIRS phantom. Dashed black lines represent the depth of planes used for the 2-dimensional MatriXX PT planar dose measurements. Percentage of image voxels with passing γ-index values for the mid–spread-out Bragg peak (SOBP) (c) and distal SOBP (d) dose planes for all tissue-surrogate plans.

