
Fig. 6.
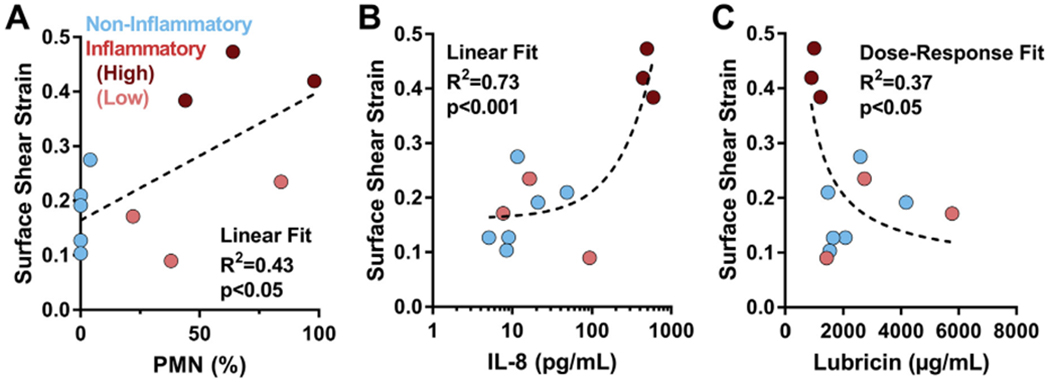
PMN, IL-8, and lubricin concentrations explain maximum shear strains at tissue surface. Surface shear strain variability for both inflammatory (red) and non-inflammatory (blue) samples were explained by (A) PMN concentration (B) IL-8 concentration, and (C) lubricin concentration. PMN and IL-8 data fit to linear curves, and lubricin data fit to a dose—response curve. For inflammatory samples, dark red = high strain subset; light red = low strain subset.