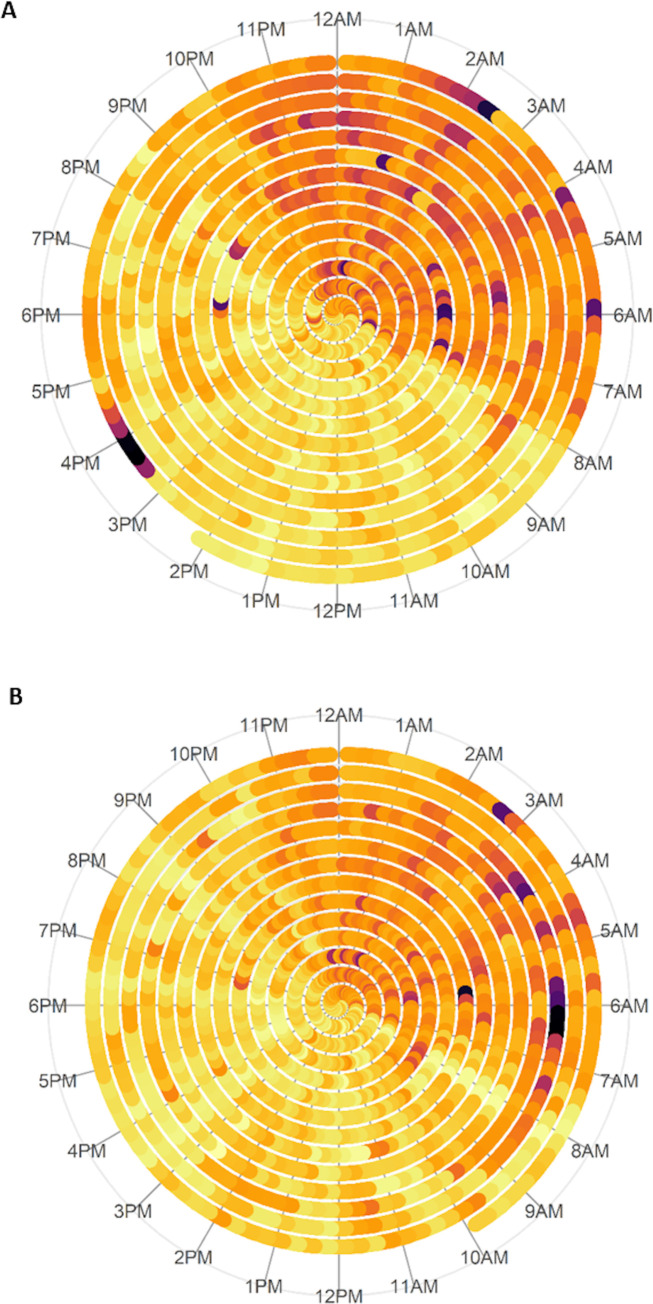
Fig 1. Visual representation of rest-activity patterns over 14-day data collection period.
Darker colours (orange, purple) represent low activity levels; lighter colours (yellow, light orange) represent higher activity levels. A) shows activity data from a participant with good sleep duration, RA and sleep efficiency; B) shows activity for a participant with shorter sleep duration and lower RA and sleep efficiency.

