Fig 5.
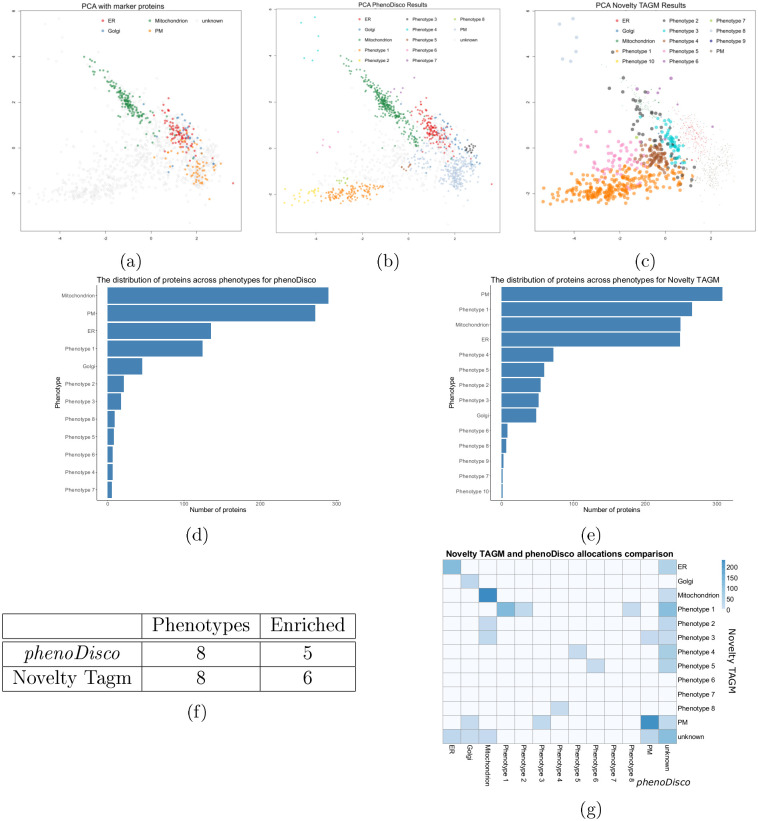
(a) PCA plot showing marker proteins for the HEK-293 dataset. (b) PCA plot with phenotypes identified by phenoDisco. (c) PCA plot with phenotypes identified by Novelty TAGM with pointer size scaled to discovery probability. (d, e) Barplots showing the number of proteins allocated to different phenotypes by phenoDisco and Novelty TAGM respectively. (f) A table demonstrating the number of phenotypes with functional enrichment for both methods and the number of phenotypes discovered. (g) A heatmap showing the overlap between phenoDisco and Novelty TAGM allocations.

