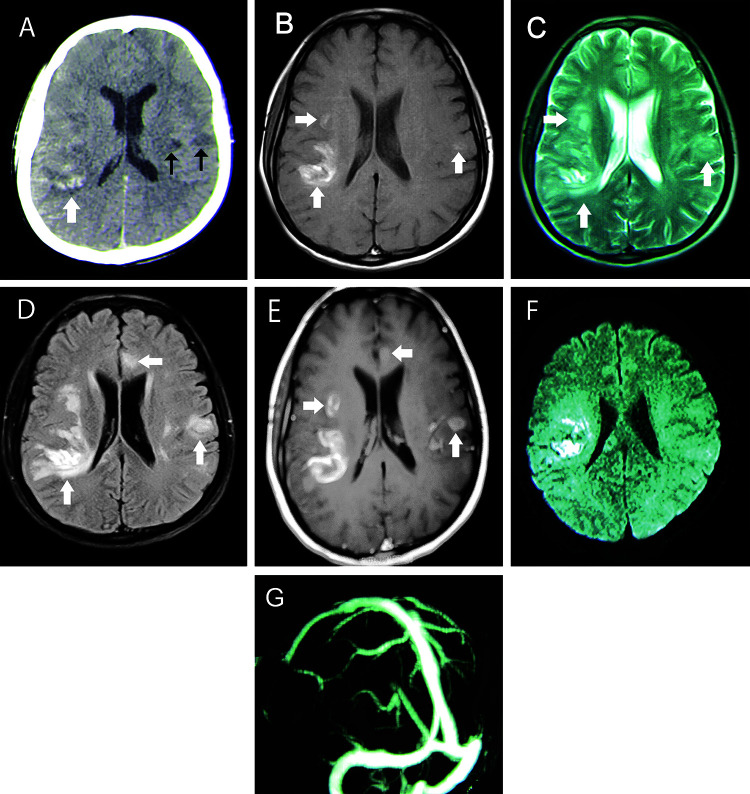
Figure 1.
(A) Non-enhanced spiral brain computed tomography (CT) scan shows hemorrhagic lesions with surrounding edema in the right parietal lobe (white arrow) and two hypodensities in the left parietal lobe (black arrows). (B) T1-weighted and (C) T2-weighted magnetic resonance (MR) images show multiple hyperintense lesions with surrounding edema in the right and left parietal lobes predominantly on the right side (white arrows). (D) Fluid-attenuated inversion recovery (FLAIR) MR images show multiple hyperintensities in the frontoparietal lobes, especially on the right side, and a mild mass effect on the right lateral ventricle (white arrows). (E) Contrast-enhanced T1-weighted MR image shows multiple ring-enhancing lesions in the frontoparietal lobes, especially on the right side (white arrows). (F) Diffusion-restriction of the right parietal lobe lesions is seen in the diffusion-weighted MR image. (G) Brain MR venography is normal.

