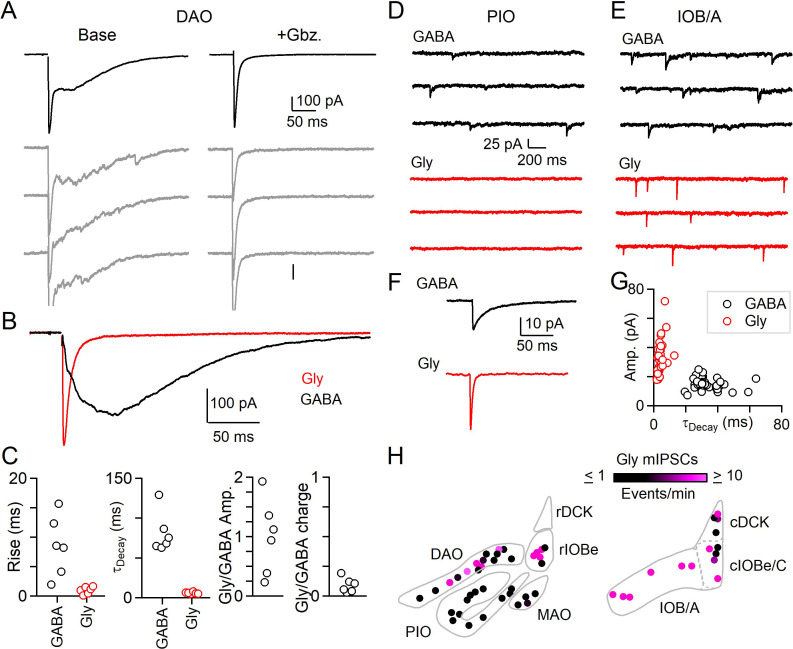
Figure 2. Evoked and spontaneous glycinergic input to the IO.
(A) Electrically evoked IPSCs in the DAO with average (top, black) and individual trials (gray), before (left) and after washing of Gbz. (right). (B) Average Gbz.-sensitive IPSC (GABA, black) and strychnine-sensitive IPSC (Gly, red) for cell in A. (C) Properties of GABA and glycine components of evoked release in the DAO, showing the rise and decay kinetics (left) and ratios of glycine and GABA evoked amplitude and charge (right). Markers are individual cells. (D) Top: Example of mIPSCs in a PIO neuron recorded in the presence of strychnine (left). Bottom: Same as in top, but for a different PIO neuron recorded in the presence of Gbz. No events were detected over the course of 10 min. (E) Same as in D, but for two cells in the IOB/A subnuclei. F: Average mIPSCs for cells in E. (G) Plot of amplitude vs. decay time for averaged mIPSCs of all cells across the IO. Each marker is a cell. (H) Color-coded map of glycinergic mIPSC frequencies for all recorded cells in the rostral (left) and caudal (right) IO. Markers are individual cells.


