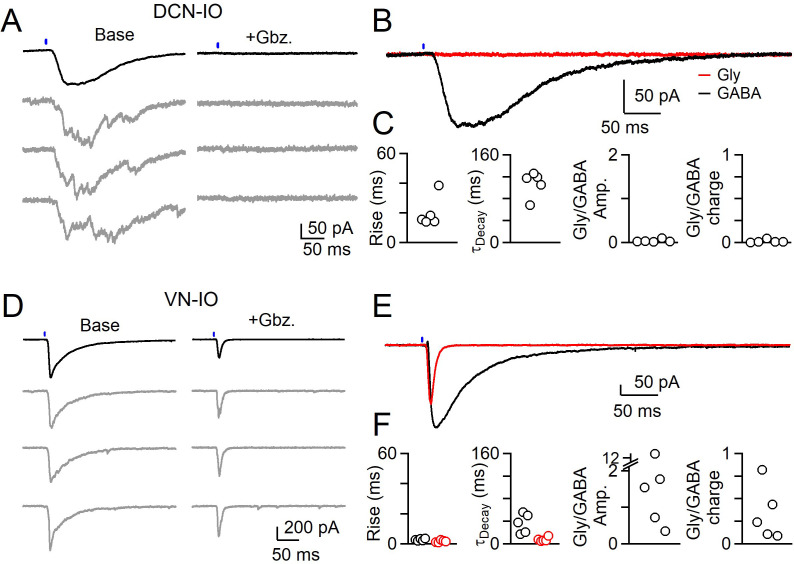
Figure 5. Different sources of inhibition to the IO use different neurotransmitters.
(A) IPSCs evoked by optical stimulation of DCN inputs to a DAO neuron with average (black) and individual trials (gray) before (left) and after washing of Gabazine (left). (B) Average overlaid Gabazine-sensitive (black, GABA) and strychnine-sensitive (red, Gly) IPSCs for cell shown in A. (C) Properties of averaged GABA (black) and Glycine (red) components of release originating from the DCN for each cell, with rise (left), decay (middle) times and ratio of Glycine and GABA IPSC charge. No Glycine component was detected in any cell. (D) Same as in A, but for optically-evoked vestibular input to a cell in the IOB/A. (E) Overlaid averaged Gabazine-sensitive (black, GABA) and strychnine-sensitive (red, Gly) IPSCs for cell shown in D. (F) Same as C, but for properties of vestibular inputs to IO neurons.

